 English
  Русский
 Bahasa Indonesia
 Bahasa Malay
 ไทย
ไทย Español
 Deutsch
 Български
 Français
 Tiếng Việt
 中文
中文 বাংলা
বাংলা हिन्दी
 Čeština
 Українська
 Română

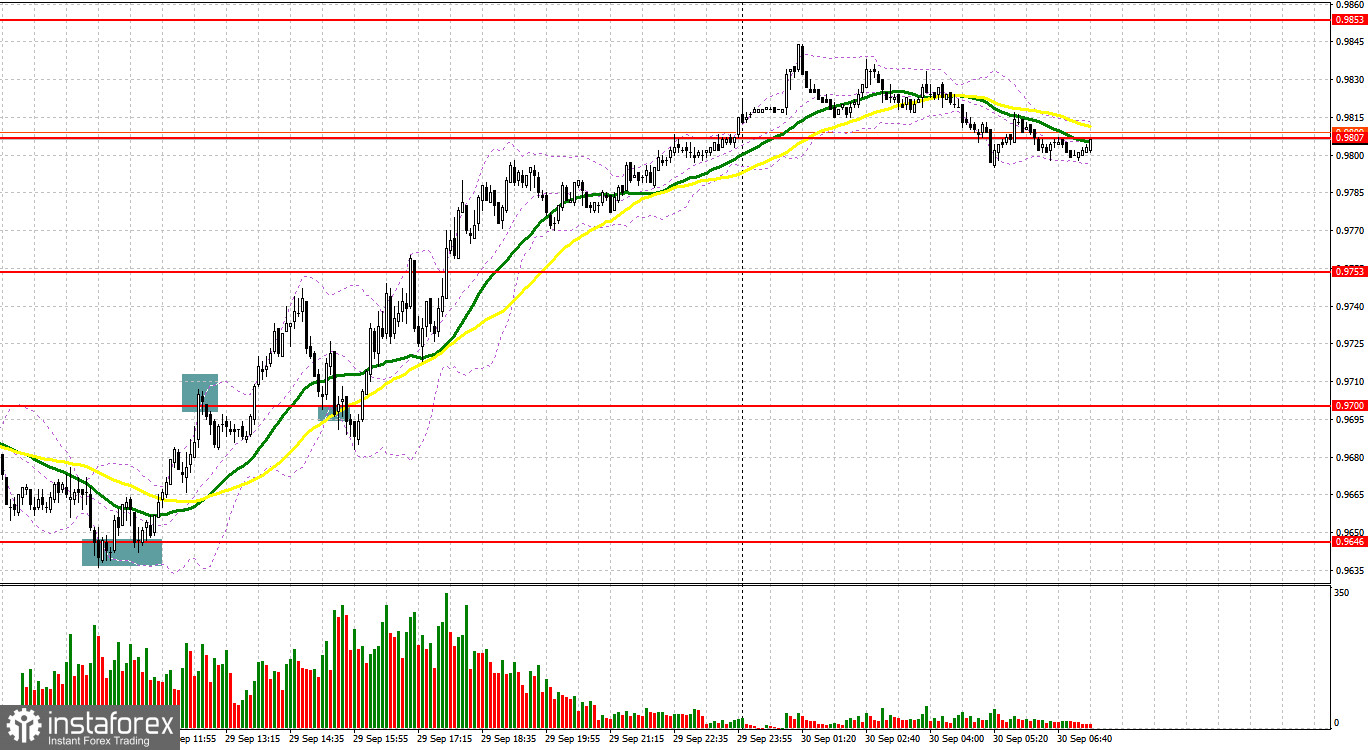
A few entry signals were formed yesterday. Let's take a look at the M5 chart to get a picture of what happened. In my previous review, I focused on 0.9646 and considered entering the market at this level. After the fall in the euro to 0.9646 in the first half of the day, a false breakout generated a buy signal, and the price soared by 60 pips. Right after the retest of the 0.9695 mark, bears attempted to regain control over the level, which produces a sell signal. The price dropped by 20 pips, and demand for the euro increased. The pair encountered support from disappointing fundamentals in the United States. In the second half of the day, bulls managed to protect the level of 0.9700. A buy signal was made, and the quote grew by over 60 pips.
When to go long on EUR/USD:
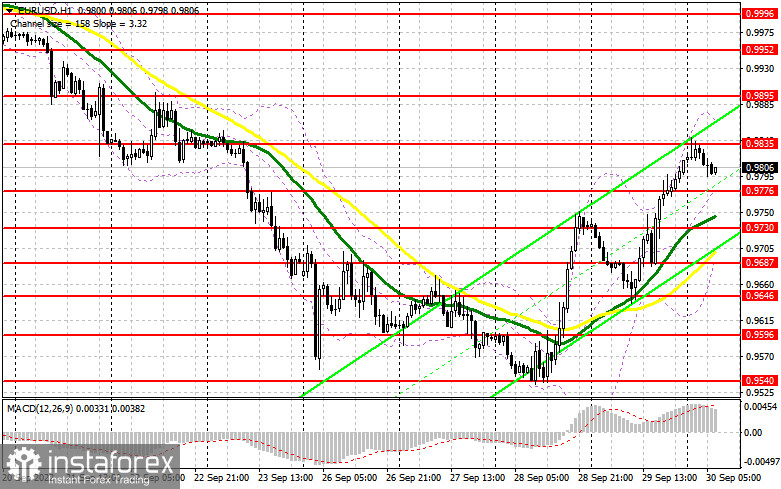
Today's macroeconomic calendar is full of important releases that could cause turbulence in the market in the first half of the day. Investors' primary focus will be on reports published in Germany, namely, retail sales and unemployment. Indeed, a steep fall in retail sales in September could seriously affect the country's GDP quarterly results, which, in turn, would be harmful to the euro. The eurozone Consumer Price Index will be released next. The reading could hit 9.7%. Should the CPI rise even higher, the bulls would stop actively buying the euro in the face of further rate hikes and increasing recession risks. Meanwhile, data on unemployment in the eurozone for August could hardly surprise traders. In this light, if the pair goes down, I would focus on 0.9776. A false breakout through the mark could produce a buy signal with the target at the 0.9835 weekly high. An additional buy signal with the target at 0.9895 could be generated if the price breaks through the barrier and tests it from top to bottom and Germany's and the eurozone's macro data come strong. Likewise, it could trigger a row of bearish stop orders. A more distant target stands at 0.9952, where it would become possible to lock in profits. If EUR/USD goes down when there is a lack of bullish activity at 0.9776, the pressure on EUR could increase. The price would then fall to 0.9730, in line with the bullish moving averages. Then, long positions could be opened at 0.9730 after a false breakout only. Long positions could also be considered at 0.9687 on a bounce or at 0.9646, allowing an upward correction of 30-35 pips intraday.
When to go short on EUR/USD:
The bears have once again lost control over the market. Retracing up, the quote has approached important resistance but will unlikely break through the barrier without the support from strong fundamentals. Therefore, the bears should first protect 0.9835 resistance, formed during the Asian session. A sell entry point would be created after a breakout through the barrier. In case of strong macro results in the eurozone and Germany, the price could plunge to 0.9776. An additional buy signal could be produced if the price breaks through the mark, consolidates, and tests the level from top to bottom. Likewise, it could trigger a row of bullish stop orders, and the price could dip to 0.9730, in line with the moving averages able to limit the pair's downside potential. A more distant target is seen at 0.9687, where it would become possible to lock in profits. Should EUR/USD surge during the European session when there is a lack of bearish activity at 0.9835, demand for EUR would increase, triggering a strong bullish correction. In such a case, rushing to sell the instrument would be unwise. If EUR/USD shows growth, the price could test 0.9895 resistance. Then, it would become possible to sell the pair after a false breakout only. Short positions on EUR/USD could be considered at the 0.9952 high on a bounce or at 0.9996, allowing a downward correction of 30-35 pips.
Commitments of Traders:
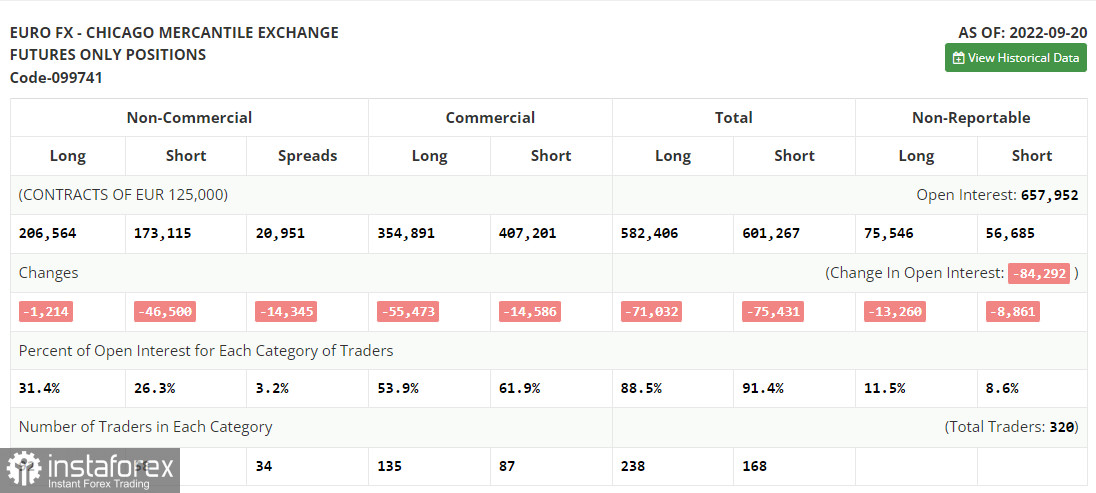
The COT report for September 20 logged a decrease in both long and short positions. The data reflects the ECB's September meeting and a sharp rate hike of 0.75%. Still, the report did not take into account the Fed's meeting where the benchmark rate was also raised by 0.75%. So, there is still a gap between the interest rates of the US regulator and the ECB. As a result, pressure on the euro mounted. In fact, the current economic developments in the eurozone are weighing on the euro. Its value has already dropped to 0.95 and is unlikely to recover any time soon. A worsening geopolitical situation in the world has a significant influence on the eurozone. It may greatly slacken the European economy in the fall and winter seasons. Therefore, the economy may slip into recession as early as spring of 2023. That is why in the medium term, the euro will hardly gain in value. Even if fundamentals in the US come disappointing, investors will still give preference to safe-haven assets, including the greenback. Based on the COT report, the number of long non-commercial positions dropped by 1,214 to 206,564 and the number of short non-commercial positions tumbled by 46,500 to 173,115. At the end of the week, the total non-commercial net position turned positive and surged to 33,449 from -11,832. This means that investors have taken advantage of the situation and continued to buy the cheap euro and accumulate long positions, hoping for the crisis to end soon. The weekly closing price rose to 1.0035 from 0.9980.
Indicator signals:
Moving averages
Trading is carried out above the 30-day and 50-day moving averages, signaling the possibility of a correction.
Note: The period and prices of moving averages are viewed by the author on the hourly chart and differ from the general definition of classic daily moving averages on the daily chart.
Bollinger Bands
In case of growth, the upper band at around 0.9870 is seen as resistance.
Indicator description:
- Moving average (MA) determines the current trend by smoothing volatility and noise. Period 50. Colored yellow on the chart.
- Moving average (MA) determines the current trend by smoothing volatility and noise. Period 30. Colored green on the chart.
- Moving Average Convergence/Divergence (MACD). Fast EMA 12. Slow EMA 26. SMA 9.
- Bollinger Bands. Period 20
- Non-commercial traders are speculators such as individual traders, hedge funds, and large institutions who use the futures market for speculative purposes and meet certain requirements.
- Long non-commercial positions are the total long position of non-commercial traders.
- Non-commercial short positions are the total short position of non-commercial traders.
- Total non-commercial net position is the difference between short and long positions of non-commercial traders.