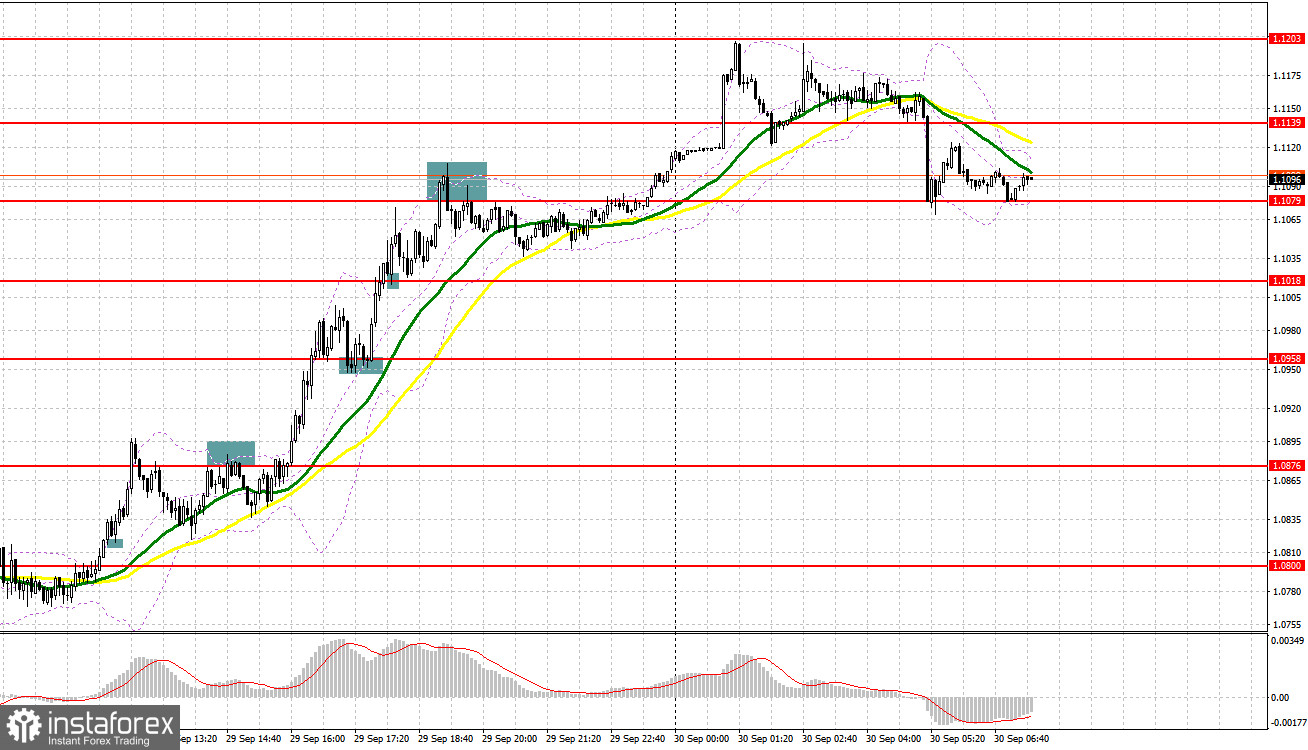
Yesterday, traders received a lot of good signals to enter the market. Let us take a look at the 5-minute chart to find out what happened. Earlier, I asked you to pay attention to the level of 1.0818 to decide when to enter the market. After a small correction during the Asian trade, buyers returned to the market, expecting more significant support from the Bank of England. A breakout and test of 1.0818 led to a good buy signal, which boosted the pair by more than 50 pips. In the second part of the day, demand for the pound/dollar pair became higher. As a result, a breakout and reverse test of 1.0958 and 1.1018 led to a buy signal, which allowed the pair to climb by 60 pips and 40 pips respectively. Only by the end of the day, a failure to consolidate at 1.1079 gave a sell signal. As a result, the asset dropped by 40 pips.

Conditions for opening long positions on GBP/USD:
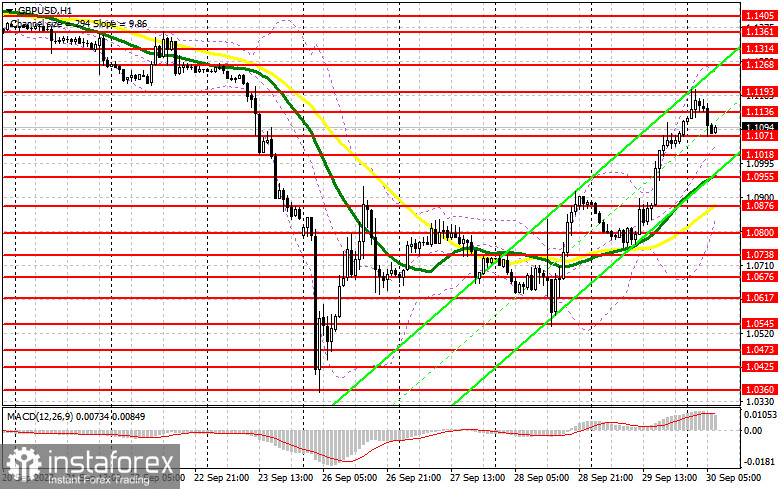
Today, the UK is going to publish a bulk of information that may cool down buyers of the pound sterling. Traders should primarily pay attention to the UK GDP data for the second quarter. The indicator is expected to decline. What is more, economists will hardly revise it upward. This may discourage traders. The current account, business investment indicator, and Nationwide HPI are of secondary importance. However, traders should also take them into account when choosing a trading strategy. If the pound/dollar pair declines, bulls may become active near the intermediate support level of 1.1071. It will be wise to open long positions after a false breakout of this level, which will give a buy signal with the target at 1.1136. A breakout and a downward test of this area may affect speculators' stop orders, thus forming a new buy signal with the target at 1.1193. The next target is located at 1.1268, where it is recommended to lock in profits. If the political situation in the UK or the whole world deteriorates, the pound sterling may slide even deeper. If buyers fail to protect 1.1071, pressure on the pair will increase. In this case, the price may decrease to a low of 1.1018. Traders may open buy orders there only after a false breakout. It is also possible to go long just after a bounce off 1.0955 or lower – from 1.0876, expecting a rise of 30-35 pips.
Conditions for opening short positions of GBP/USD:
Sellers cannot regain control over the market since decisive measures of the BoE somehow stabilized the market situation. Under the current conditions, it will be better to open sell orders after a false breakout of the intermediate resistance level of 1.1136. To relaunch the downtrend, sellers should be very active at 1.1071. An upward test of this area will give a good sell signal with the target at 1.1018 which is not far from 1.0955. The next target is located at the low of 1.0955, where it is recommended to lock in profits. However, the pair may move there only if the UK government takes unreasonable steps. If the pound/dollar pair advances and bears fail to protect 1.1136, the correction may continue, thus allowing the pair to return to its weekly high of 1.1193. Only a false breakout of this level will give a sell signal. If bears fail to be active, traders could sell the asset just after a rebound from 1.1268, expecting a drop of 30-35 pips.

COT report
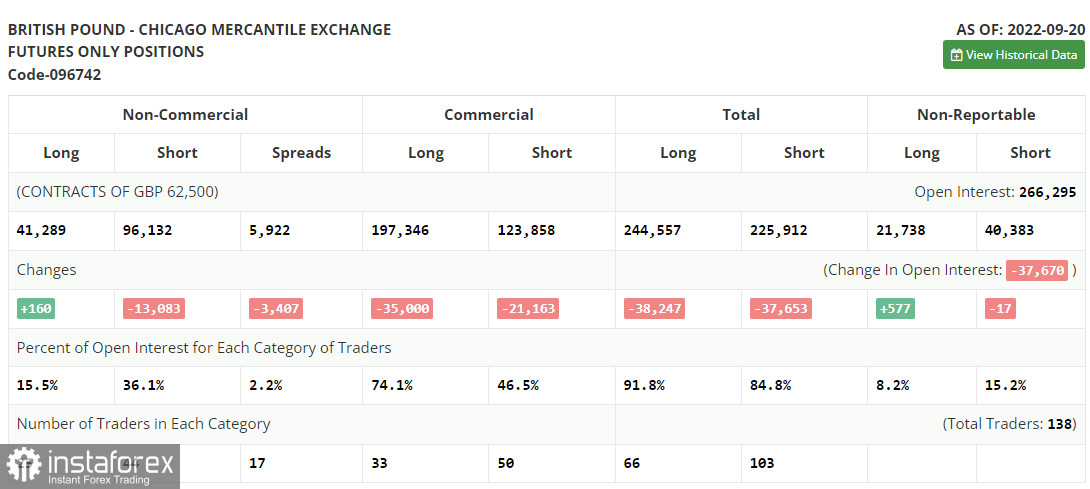
According to the COT report from September 20, the number of long positions increased, whereas the number of short positions dropped. However, this report does not reflect the actual market situation. For this reason, I would not advise you to pay great attention to it. There have been lots of changes in just a few days in the UK. They are now setting the trend. Last week, the Bank of England raised interest rates by only 0.5%. It appears that the central bank has already regretted this decision. After that, the HM Treasury announced tax cuts to help households to cope with high energy prices and stimulate the economy. However, it could fuel inflation which the Bank of England is still unable to cap. As a result, traders rushed to sell off the pound sterling. It nosedived by almost 1,000 pips in just two days. Investors took advantage of this drastic decline and bought it at a lower price. So, the pound sterling regained losses. However, it is difficult to say that it has already found the bottom. The UK is going to publish a bulk of macroeconomic reports this week, which could escalate pressure on the pound sterling. The latest COT report unveiled that the number of long non-commercial positions increased by 160 to 41,289, whereas the number of short non-commercial positions dropped by 13,083 to 96,132. It led to a small decrease in the negative delta of the non-commercial net position to -54,843 versus - 68,086. The weekly closing price slid to 1.1392 from 1.1504.

Signals of indicators:
Moving Averages
Trading is performed above the 30- and 50-day moving averages, which points to the continuation of the upward correction.
Note: The period and prices of moving averages are considered by the author on the one-hour chart, which differs from the general definition of the classic daily moving averages on the daily chart.
Bollinger Bands
If the pair increases, the resistance level will be located at 1.1240, the upper limit of the indicator.
Description of indicators
- Moving average (moving average, determines the current trend by smoothing volatility and noise). The period is 50. It is marked in yellow on the chart.
- Moving average (moving average, determines the current trend by smoothing volatility and noise). The period is 30. It is marked in green on the graph.
- MACD indicator (Moving Average Convergence/Divergence - convergence/divergence of moving averages). A fast EMA period is 12. A slow EMA period is 26. The SMA period is 9.
- Bollinger Bands. The period is 20.
- Non-profit speculative traders are individual traders, hedge funds, and large institutions that use the futures market for speculative purposes and meet certain requirements.
- Long non-commercial positions are the total number of long positions opened by non-commercial
- traders.
- Short non-commercial positions are the total number of short positions opened by non-commercial traders.
- The total non-commercial net position is a difference in the number of short and long positions opened by non-commercial traders.
 English
 Русский
 Bahasa Indonesia
 Bahasa Malay
 ไทย
ไทย Español
 Deutsch
 Български
 Français
 Tiếng Việt
 中文
中文 বাংলা
বাংলা हिन्दी
 Čeština
 Українська
 Română

