 English
  Русский
 Bahasa Indonesia
 Bahasa Malay
 ไทย
ไทย Español
 Deutsch
 Български
 Français
 Tiếng Việt
 中文
中文 বাংলা
বাংলা हिन्दी
 Čeština
 Українська
 Română

Details of the economic calendar for September 29
The final data on the GDP of the United States for the second quarter coincided with preliminary estimates. Thus, their influence on the market was reduced to zero.
Together with the GDP data, weekly jobless claims figures were released, which fell significantly. This is a positive factor for the US labor market, which led to a local strengthening of dollar positions at the time of the release of statistics.
Statistics details:
The volume of continuing claims for benefits fell from 1.376 million to 1.347 million.
The volume of initial claims for benefits fell from 209,000 to 193,000.
Analysis of trading charts from September 29
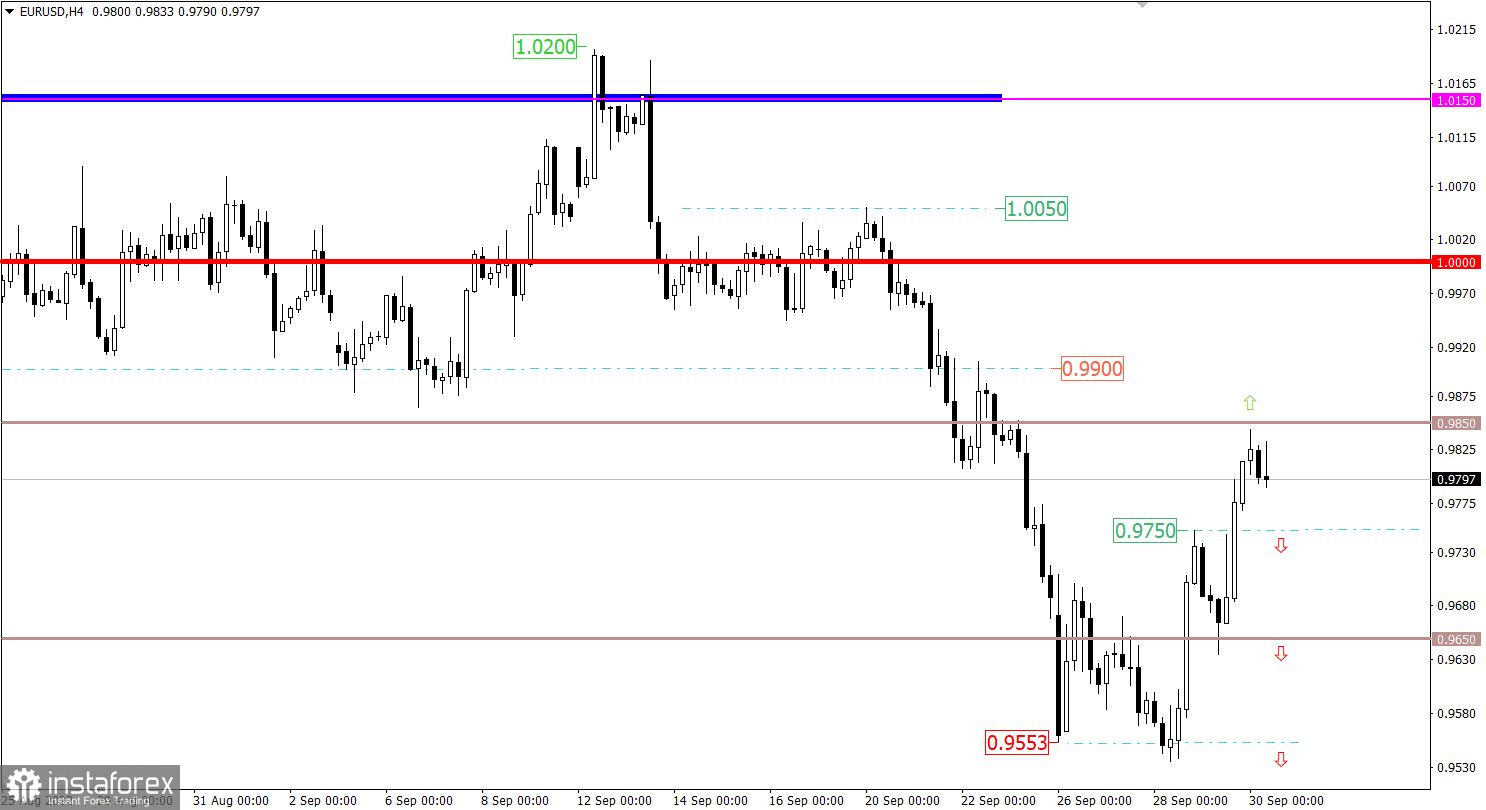
The EURUSD currency pair is in correction from the local low of the downward trend. As a result, euro positions strengthened in value by about 3.2%, which is about 300 points. Despite the fact that the volume of the upward movement is considerable, the euro is still cheap.
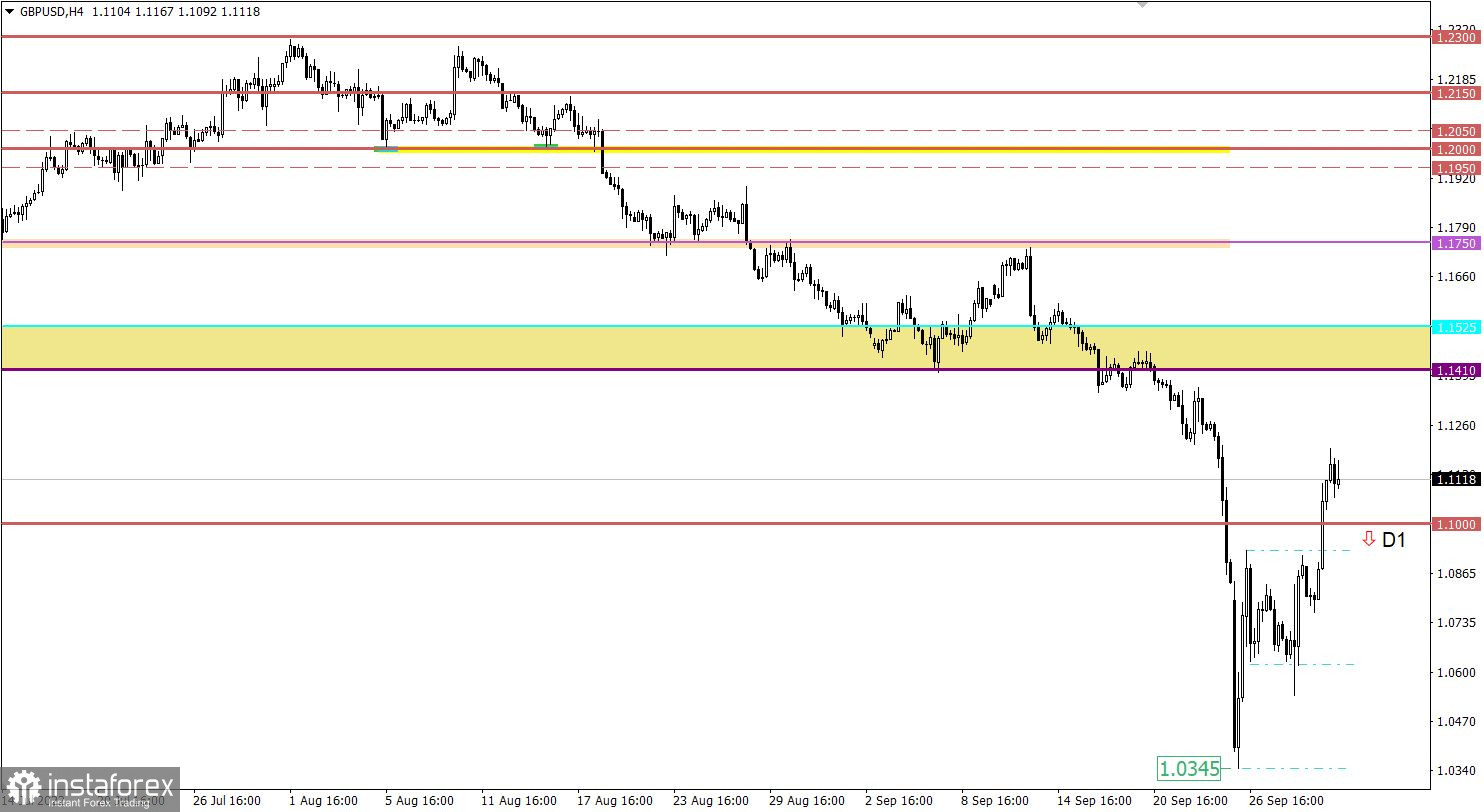
The GBPUSD currency pair completed the amplitude movement in the range of 1.0630/1.0930 by breaking its upper limit. As a result, there was a technical signal about a prolonged corrective move from the low of the downward trend.

Economic calendar for September 30
At the opening of the European session, the final data on UK GDP for the second quarter were published, which gave a pleasant surprise. GDP for the second quarter grew by 0.2% compared to the previous forecast of -0.1%, and in annual terms increased to +4.4% against the previous estimate of 2.9%.
In Britain, data on the lending market will also be published, where a widespread decline is predicted. This is not the best signal for the country's economy. Let's see if the forecasts match.
The European Union expects the publication of preliminary data on inflation, which is predicted to rise from 9.1% to 9.7%. Rising consumer prices again indicate that the ECB is not tightening monetary policy sufficiently. In fact, with the growth of inflation, a signal about a further increase in interest rates is likely.
In this case, the euro may continue to strengthen.
Time targeting:
UK lending market – 08:30 UTC
EU Inflation – 09:00 UTC
Trading plan for EUR/USD on September 30
Preservation of the corrective move on the market may well return the quote to the parity level. A technical signal about further growth will appear after the price holds above the level of 0.9850.
Traders will considere the downward scenario if the price stays below the value of 0.9750.
It is worth noting that the market has been heavily subject to speculation lately. For this reason, chaotic price jumps may occur, in which signals from technical analysis will be ignored.
Trading plan for GBP/USD on September 30
The scale of the strengthening of the pound sterling is almost comparable to the recent collapse. Even though the pound is still oversold when viewed in the medium and long term. Thus, the preservation of the current correction on the market may lead to a subsequent strengthening of the British currency to the area of 1.1410/1.1525.
An alternative scenario in which the downward cycle could resume will be considered by traders after holding the price below the 1.1000 level in the daily period.
What is shown in the trading charts?
A candlestick chart view is graphical rectangles of white and black light, with sticks on top and bottom. When analyzing each candle in detail, you will see its characteristics of a relative period: the opening price, closing price, and maximum and minimum prices.
Horizontal levels are price coordinates, relative to which a stop or a price reversal may occur. These levels are called support and resistance in the market.
Circles and rectangles are highlighted examples where the price of the story unfolded. This color selection indicates horizontal lines that may put pressure on the quote in the future.
The up/down arrows are the reference points of the possible price direction in the future.