 English
  Русский
 Bahasa Indonesia
 Bahasa Malay
 ไทย
ไทย Español
 Deutsch
 Български
 Français
 Tiếng Việt
 中文
中文 বাংলা
বাংলা हिन्दी
 Čeština
 Українська
 Română

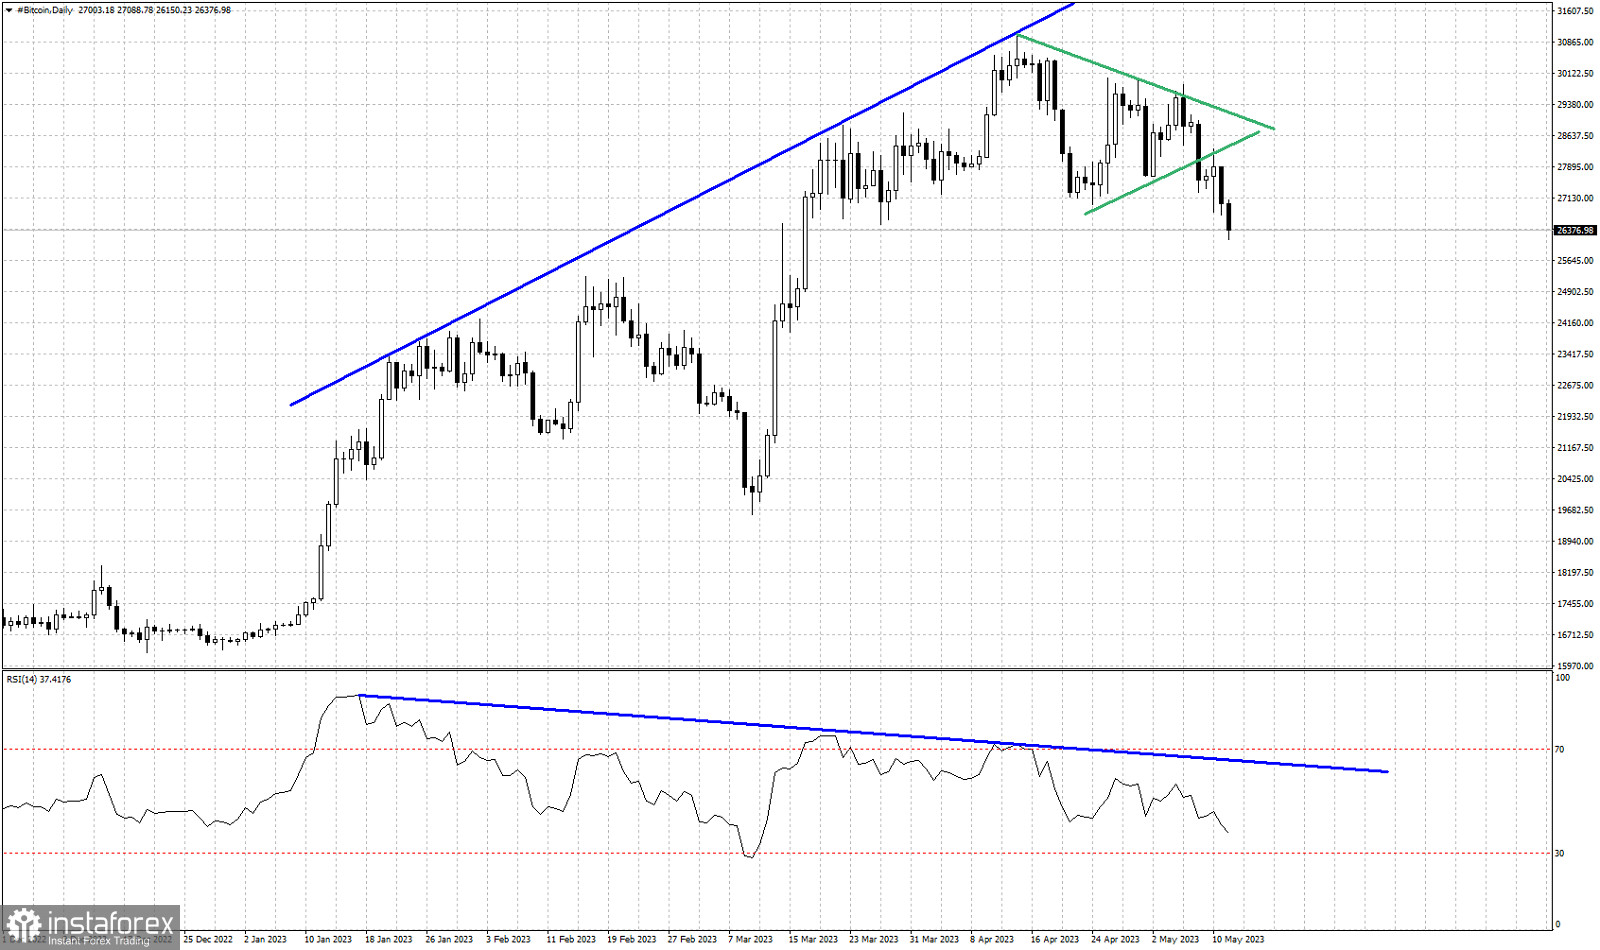
Blue lines- bearish RSI divergence
Green lines- triangle pattern (broken downwards)
Bitcoin is trading below $27,000. As we explained in previous posts, Bitcoin's run of new higher highs was soon to end because the RSI was not following. Not only this, but the new triangle pattern also broke to the downside a couple days ago. All these indicators showed that price was vulnerable to the downside. From $31,000 price has so far declined approximately 15%. Bitcoin today is making new lower lows with the RSI having also a negative slope. The RSI has still not reached oversold levels so we can not talk about a short-term bottom yet. Bitcoin is expected to be under pressure over the coming days and we continue to expect price to reach our first pull back target of $25,000.