 English
  Русский
 Bahasa Indonesia
 Bahasa Malay
 ไทย
ไทย Español
 Deutsch
 Български
 Français
 Tiếng Việt
 中文
中文 বাংলা
বাংলা हिन्दी
 Čeština
 Українська
 Română

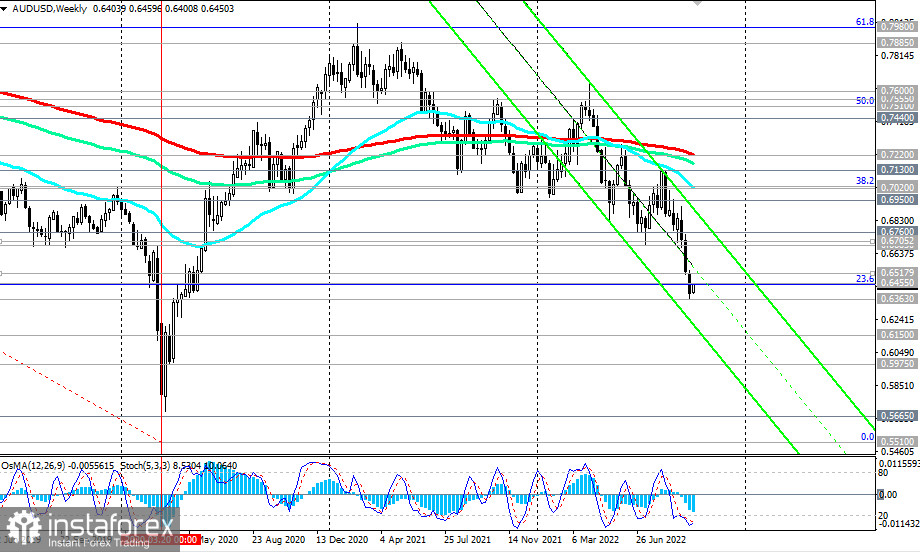
As of writing, AUD/USD is trading near 0.6450, moving inside the descending channel on the weekly chart and staying below the key resistance levels of 0.7220 (200 EMA on the weekly chart), 0.7020 (200 EMA on the daily chart).
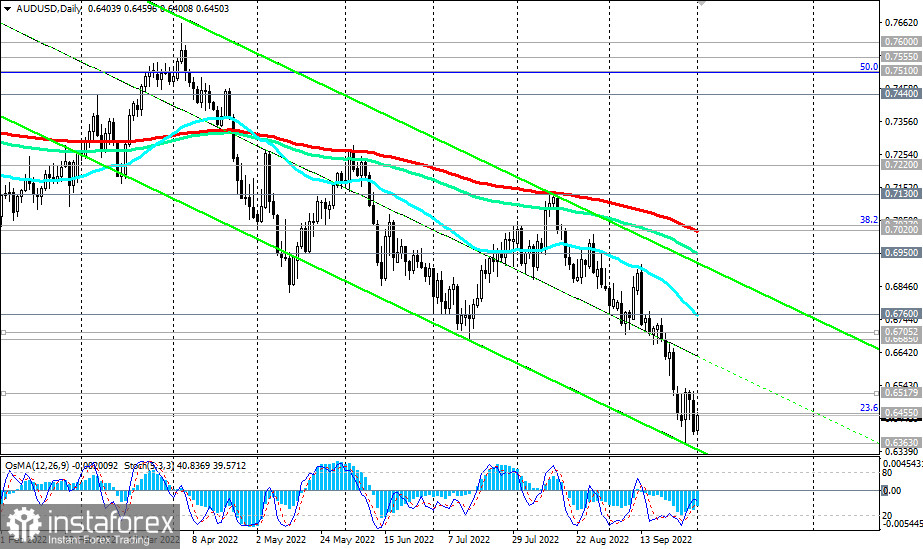
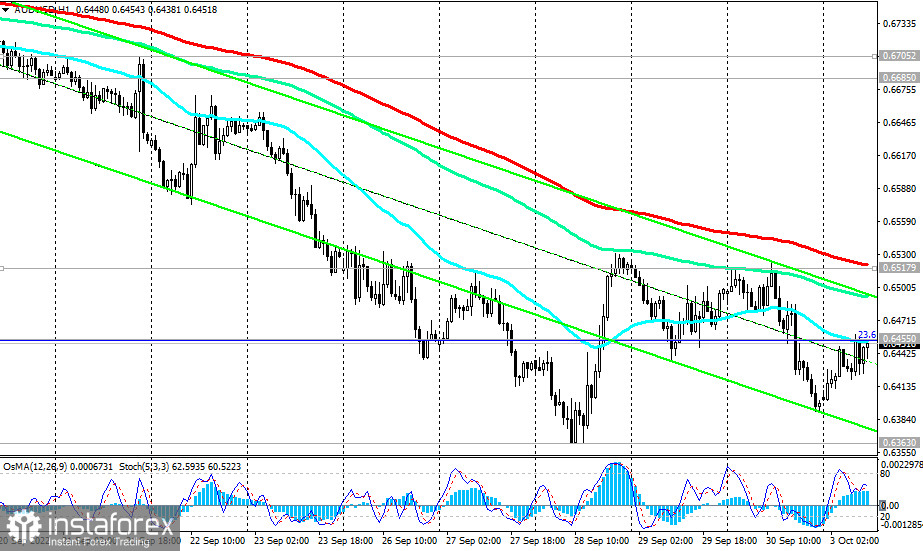
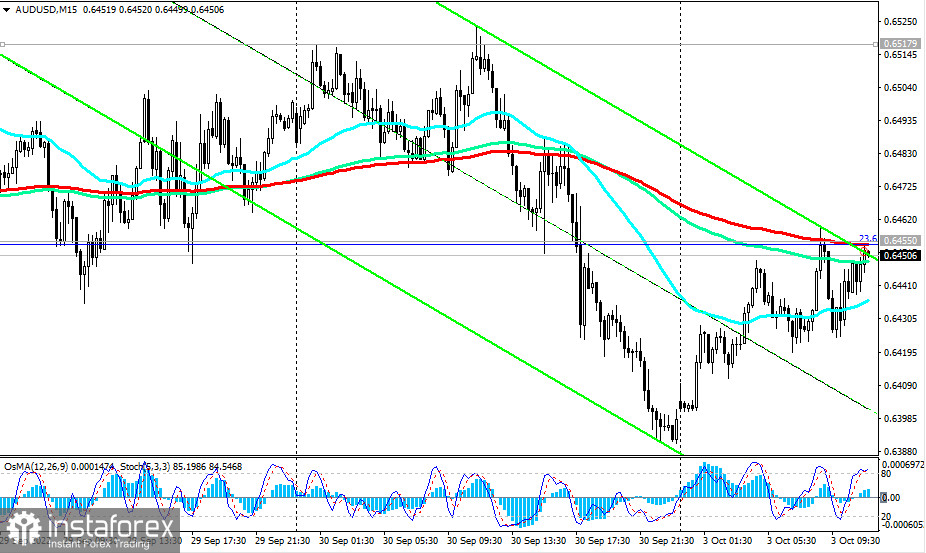
However, as can be seen from the chart, the price hit the resistance level of 0.6455 (200 EMA on the 15-minute chart and the 23.6% Fibonacci correction to the wave of the pair's decline from the level of 0.9500 in July 2014 to the lows of 2020 near the 0.5510 mark). Its breakdown may provoke further corrective growth to the resistance levels of 0.6518 (200 EMA on the 1-hour chart), 0.6700 (200 EMA on the 4-hour chart), 0.6760 (50 EMA on the daily chart). Further growth, given the global downward dynamics of AUD/USD, is unlikely.
In the main scenario, we expect a breakdown of the local support level of 0.6400 and further decline. The breakdown of the local support level of 0.6363 (May 2020 low) will be a confirming signal for our assumption. The driver of today's movement may be today's publication of important US macro statistics.
Support levels: 0.6400, 0.6363, 0.6300, 0.6200, 0.6150, 0.5975, 0.5665, 0.5510
Resistance levels: 0.6455, 0.6518, 0.6700, 0.6760, 0.6950, 0.7020, 0.7037
Trading Tips
Sell Stop 0.6390. Stop-Loss 0.6465. Take-Profit 0.6363, 0.6300, 0.6200, 0.6150, 0.5975, 0.5665, 0.5510
Buy Stop 0.6465. Stop-Loss 0.6390. Take-Profit 0.6518, 0.6700, 0.6760, 0.6950, 0.7020, 0.7037