 English
  Русский
 Bahasa Indonesia
 Bahasa Malay
 ไทย
ไทย Español
 Deutsch
 Български
 Français
 Tiếng Việt
 中文
中文 বাংলা
বাংলা हिन्दी
 Čeština
 Українська
 Română

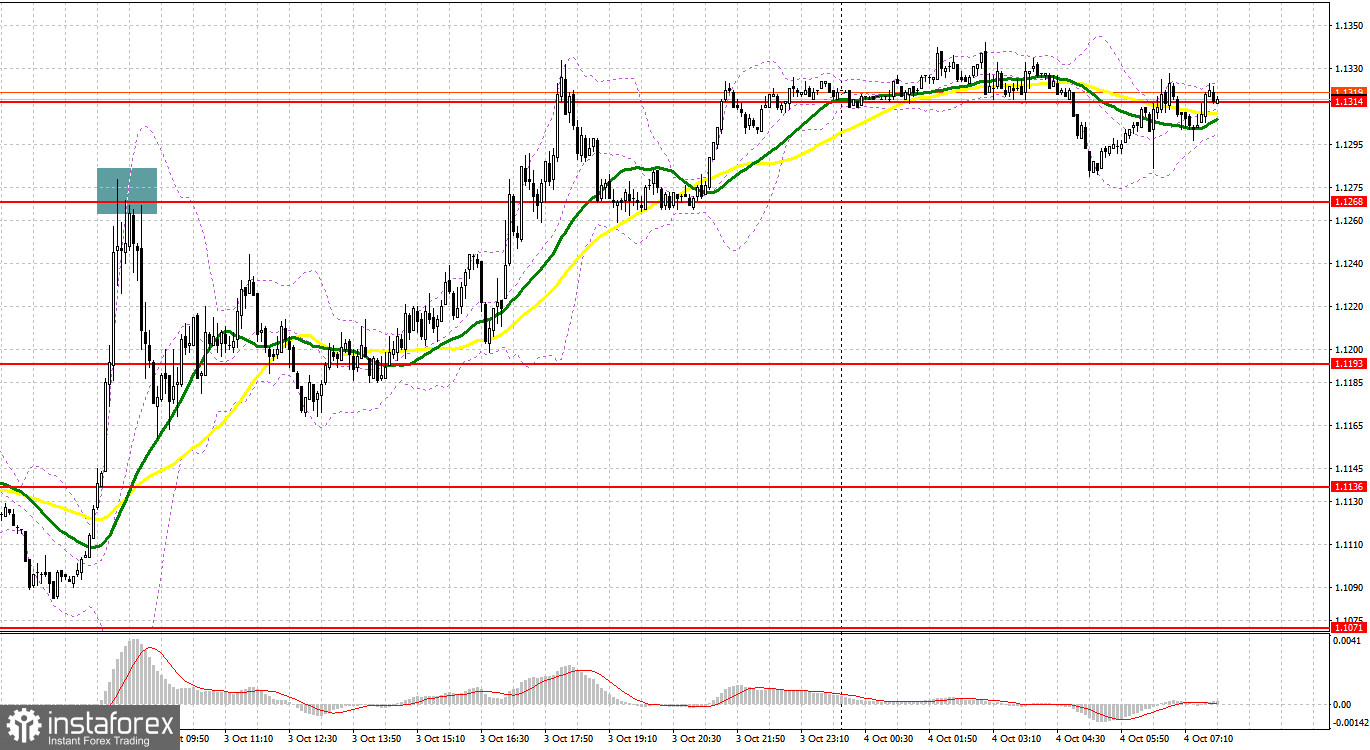
Yesterday, there was another big spike in the pair's volatility. Let's look at the 5-minute chart and figure out what happened. An unsuccessful consolidation above 1.1268 and a false breakdown at this level led to a sell signal, which resulted in the pound moving down by 100 points. Although the pair spent a lot of time around 1.1193, it was impossible to get a good entry point into the market from this level.
To open long positions on GBP/USD, you need:
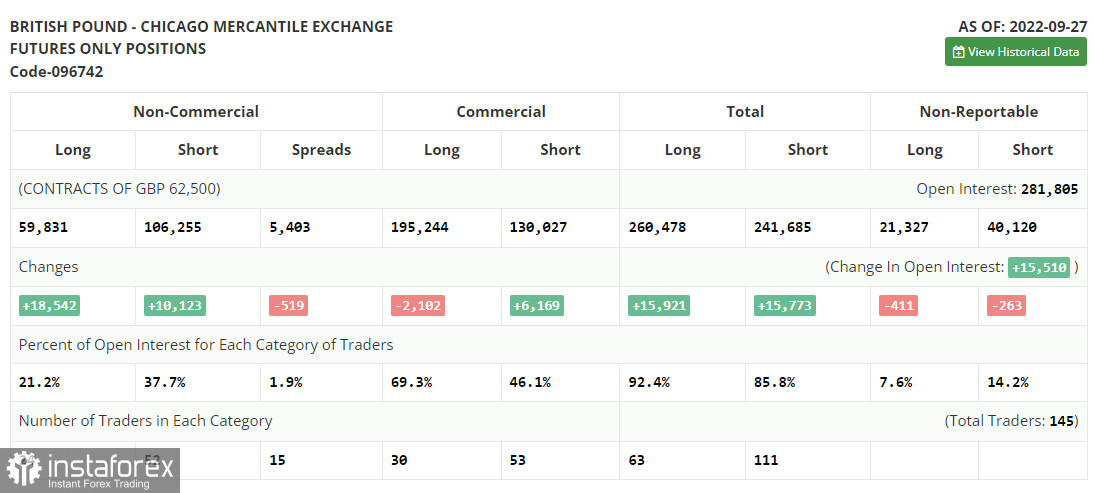
Before analyzing the technical picture of the pound, let's look at what happened in the futures market. The COT report (Commitment of Traders) for September 27 recorded a sharp increase in both long and short positions. The fact that the pound lost about 10.0% in two days, after which the Bank of England was forced to intervene in the situation, is directly related to the return of demand and the growth of long positions, which exceeded the growth of short ones. After the Bank of England raised interest rates by only 0.5%, the pound fell to historic lows against the US dollar, and many began to talk that it was so close to parity. However, the regulator's intervention in the bond market helped stabilize the foreign exchange market situation, which allowed the bulls to compensate for a significant part of the positions. However, how long will such support from the Bank of England last to keep the British pound afloat during a further increase in interest rates? This week, data on activity in the UK is expected, which could significantly harm the pound and limit its further upward potential. The latest COT report indicates that long non-commercial positions increased by 18,831 to 59,831. In contrast, short non-commercial positions jumped by 10,123 to the level of 106,255, which led to another small reduction in the negative value of the non-commercial net position - to the level of -46,424 versus -54,843. The weekly closing price collapsed and amounted to 1.0738 against 1.1392.
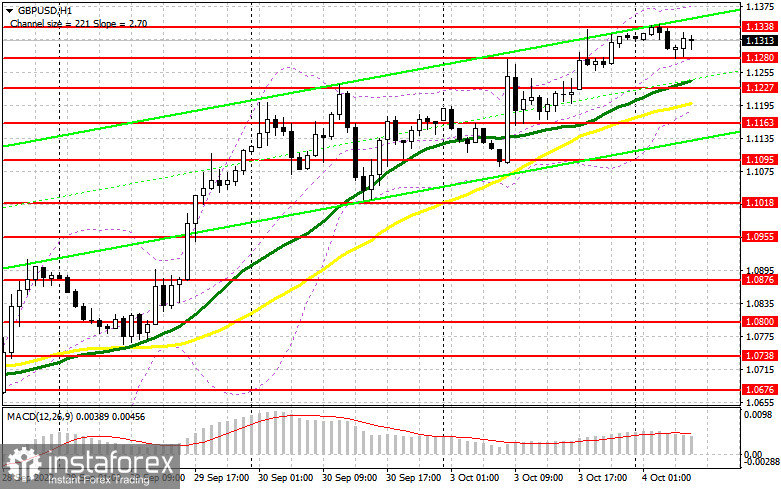
Today, nothing in the UK could put pressure on the British pound, so do not be surprised if the upward correction for the pair continues, especially against the background of maintaining such high market volatility. Buying at current levels, especially after such a collapse observed at the end of last month, is quite risky, so I advise you to look at the nearest support of 1.1280 and act based on it. In the case of a decline in GBP/USD, the optimal scenario for buying will be the formation of a false breakdown in the area of 1.1280 or slightly lower, from the level of 1.1227, where the moving averages are playing on the buyers' side. This will give us an excellent entry point to return to 1.1338. Only after getting above this range will it be possible to talk about building a further upward correction for the pair. The breakdown of 1.1338, as well as the reverse test from top to bottom, will lead to 1.1393, where buyers will find it more difficult to control the market. A more distant target will be the 1.1451 area, leading to a fairly large market capitulation of sellers. I recommend fixing profits there. If GBP/USD falls and there are no buyers at 1.1280 and 1.1227, most likely, the pressure on the pound will return. If this happens, I recommend postponing long positions to 1.1163. I advise you to buy there only on a false breakdown. It is possible to open long positions on GBP/USD immediately for a rebound from 1.1095, or around the minimum of 1.1018, with the aim of a correction of 30–35 points within a day.
To open short positions on GBP/USD, you need:
The longer the Bank of England intervenes in the bond market, the higher the pound has a chance to grow in the near future. However, at any moment, the pressure on the pair may return – nothing good is happening in the economy, and forecasts for achieving parity of the pair may still come true. The protection of the nearest resistance at 1.1338, formed by yesterday's results, is almost the most important task today. Bears should not release the pair beyond this range, as this may provoke new purchases, allowing bulls to strengthen their position in the market. In the case of GBP/USD growth, only the formation of a false breakdown at 1.1338 will put pressure on the pound and form a sell signal in the expectation of a return of the bearish trend and a decline to the nearest support of 1.1280. A breakout and a reverse test from the bottom up of this range will give an entry point for sale with a minimum test of 1.1227, but a much more interesting target will be the area of 1.1163, where the lower boundary of the future side channel can be formed. I recommend fixing profits there. With the option of GBP/USD growth and the absence of bears at 1.1338, the situation will remain under the control of buyers, albeit only for a while, which will lead to a return to 1.1393. A false breakout at this level forms an entry point into short positions in the expectation of a new downward movement of the pair. In the case of a lack of activity, there may be a jerk up to a maximum of 1.1451. I advise you to sell GBP/USD immediately for a rebound, counting on the pair's rebound down by 30-35 points within a day.
Signals of indicators:
Moving Averages:
Trading is conducted above the 30 and 50 moving averages, which indicates further growth of the pound;
Note. The author considers the period and prices of moving averages on the hourly chart H1 and differ from the general definition of the classic daily moving averages on the daily chart D1.
Bollinger Bands:
A breakthrough of the upper limit of the indicator in the area of 1.1370 will lead to a new wave of growth of the pound.
Description of indicators
- Moving average (moving average determines the current trend by smoothing out volatility and noise). Period 50. The graph is marked in yellow.
- Moving average (moving average determines the current trend by smoothing out volatility and noise). Period 30. The graph is marked in green.
- MACD indicator (Moving Average Convergence / Divergence - moving average convergence/divergence) Fast EMA period 12. Slow EMA period 26. SMA period 9
- Bollinger Bands (Bollinger Bands). Period 20
- Non-profit speculative traders, such as individual traders, hedge funds, and large institutions use the futures market for speculative purposes and to meet certain requirements.
- Long non-commercial positions represent the total long open position of non-commercial traders.
- Short non-commercial positions represent the total short open position of non-commercial traders.
- Total non-commercial net position is the difference between the short and long positions of non-commercial traders.