 English
  Русский
 Bahasa Indonesia
 Bahasa Malay
 ไทย
ไทย Español
 Deutsch
 Български
 Français
 Tiếng Việt
 中文
中文 বাংলা
বাংলা हिन्दी
 Čeština
 Українська
 Română

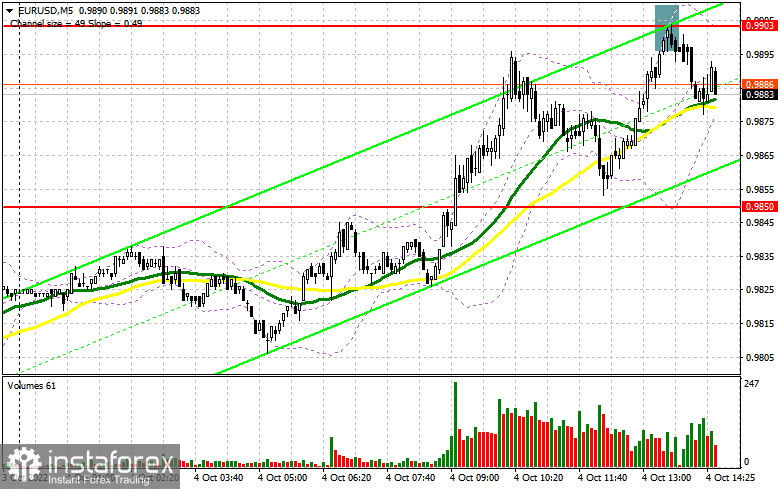
In my morning forecast, I paid attention to the 0.9903 level and recommended deciding on entering the market there. Let's look at the 5-minute chart and figure out what happened there. The breakdown of 0.9850 passed without a reverse test from top to bottom, so I could not get an entry point into long positions there. As a result of the pair's growth, the 0.9903 level was updated in the first half of the day, where a false breakdown gave a sell signal. At the time of writing, the downward movement was about 20 points. The technical picture has hardly changed for the second half of the day.
To open long positions on EURUSD, you need:
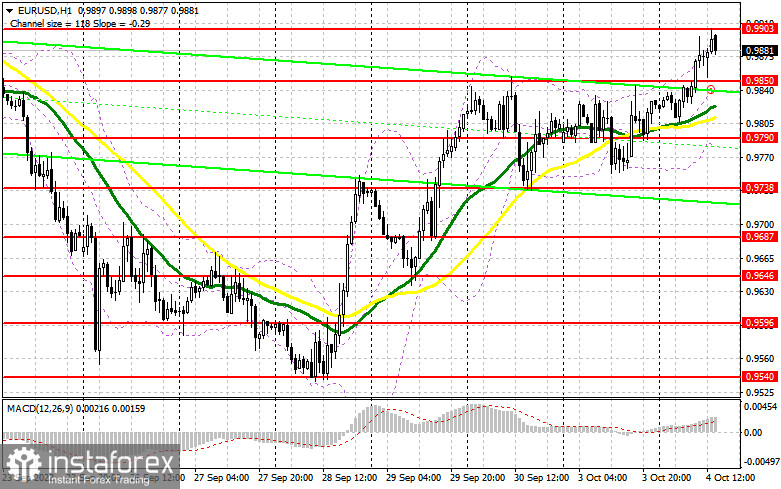
While trading will be conducted below 0.9903, you can count on the euro's movement down. However, much in the afternoon will depend on what the Fed representatives, John Williams and Loretta Mester, will tell us and what data on changes in the volume of production orders will come out. Bad data will weaken the dollar's position and further strengthen the euro. In the case of another hawkish statement by politicians and a decline in the pair, the optimal scenario for a set of long positions will be the formation of a false breakdown in the area of the morning resistance and now support - 0.9850. A little lower are the moving averages, which are playing on the bulls' side. Only this will give a good entry point in the expectation of a second spurt of the pair up to 0.9903. In the event of a return in demand for rice assets, consolidation above this range and a top-down test will cancel out all the morning efforts of the bears to control the market, which will give a signal to buy and recover to the area of 0.9952, where it will remain very close to the parity update. The furthest goal will be the 0.9996 area, where I recommend fixing the profits. If EUR/USD declines after the hawkish statements of the Fed representatives and the breakout of 0.9850, the pair will quickly slide down to the next support of 0.9790. I also recommend buying only on a false breakdown. I advise you to open long positions on EUR/USD immediately for a rebound only from the minimum of 0.9738, or even lower – around 0.9687, with the aim of an upward correction of 30–35 points within a day.
To open short positions on EURUSD, you need:
Sellers are taking risks since missing 0.9850 could run into more serious pair growth this week. The main task for the second half of the day will be to close below 0.9850, since only after that will it be possible to start thinking about the return of pressure on the euro and a new wave of decline. In the case of another upward jerk after the speech of the Fed representatives, only another false breakout at 0.9903 will give a sell signal to reduce to the level of 0.9850. There are also moving averages, which play a rather important role in determining the pair's direction. A breakdown and consolidation below 0.9850 will put pressure on the euro. A reverse test from the bottom up will form an additional sell signal with demolishing buyers' stop orders and the prospect of updating the 0.9790 minimum. A more distant goal will be the support of 0.9738, where I recommend fixing the profits. In the case of an upward movement of EUR/USD during the US session, as well as the absence of bears at 0.9903, which is more likely, buyers will gain an advantage, which will lead to a correction of the euro to the maximum of 0.9952. I advise you to sell only on a false breakdown. It is possible to open short positions immediately for a rebound only from the parity of 0.9996, or even higher – from 1.0040, with the aim of a downward correction of 30–35 points.
Signals of indicators:
Moving Averages
Trading is conducted above 30 and 50-daily moving averages, which indicates a further correction of the pair.
Note: The author considers the period and prices of moving averages on the hourly chart H1 and differ from the general definition of the classic daily moving averages on the daily chart D1.
Bollinger Bands
In case of a decline, the lower limit of the indicator, around 0.9790, will act as support.
Description of indicators
- Moving average (moving average determines the current trend by smoothing out volatility and noise). Period 50. The graph is marked in yellow.
- Moving average (moving average determines the current trend by smoothing out volatility and noise). Period 30. The graph is marked in green.
- MACD indicator (Moving Average Convergence / Divergence - moving average convergence/divergence) Fast EMA period 12. Slow EMA period 26. SMA period 9
- Bollinger Bands (Bollinger Bands). Period 20
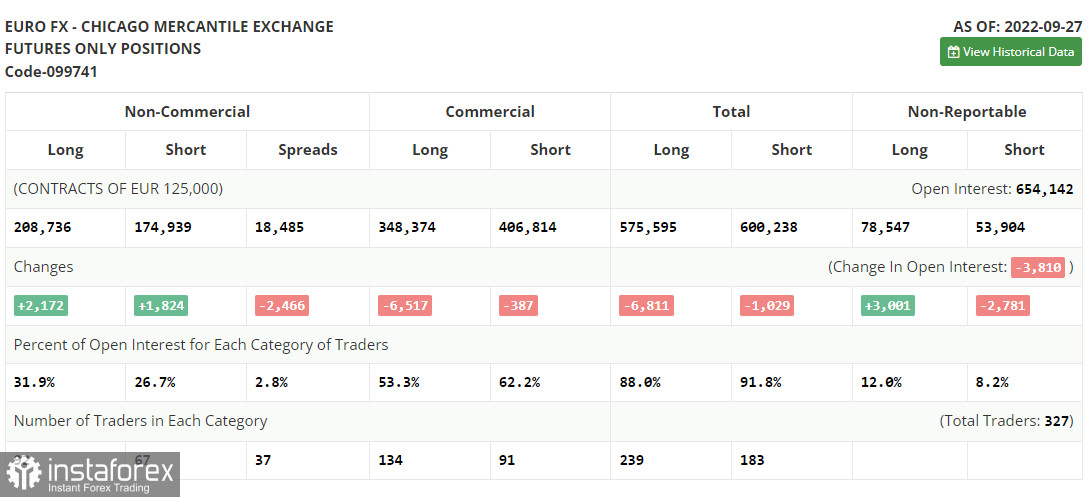
- Non-profit speculative traders, such as individual traders, hedge funds, and large institutions use the futures market for speculative purposes and to meet certain requirements.
- Long non-commercial positions represent the total long open position of non-commercial traders.
- Short non-commercial positions represent the total short open position of non-commercial traders.
- Total non-commercial net position is the difference between the short and long positions of non-commercial traders.