 English
  Русский
 Bahasa Indonesia
 Bahasa Malay
 ไทย
ไทย Español
 Deutsch
 Български
 Français
 Tiếng Việt
 中文
中文 বাংলা
বাংলা हिन्दी
 Čeština
 Українська
 Română

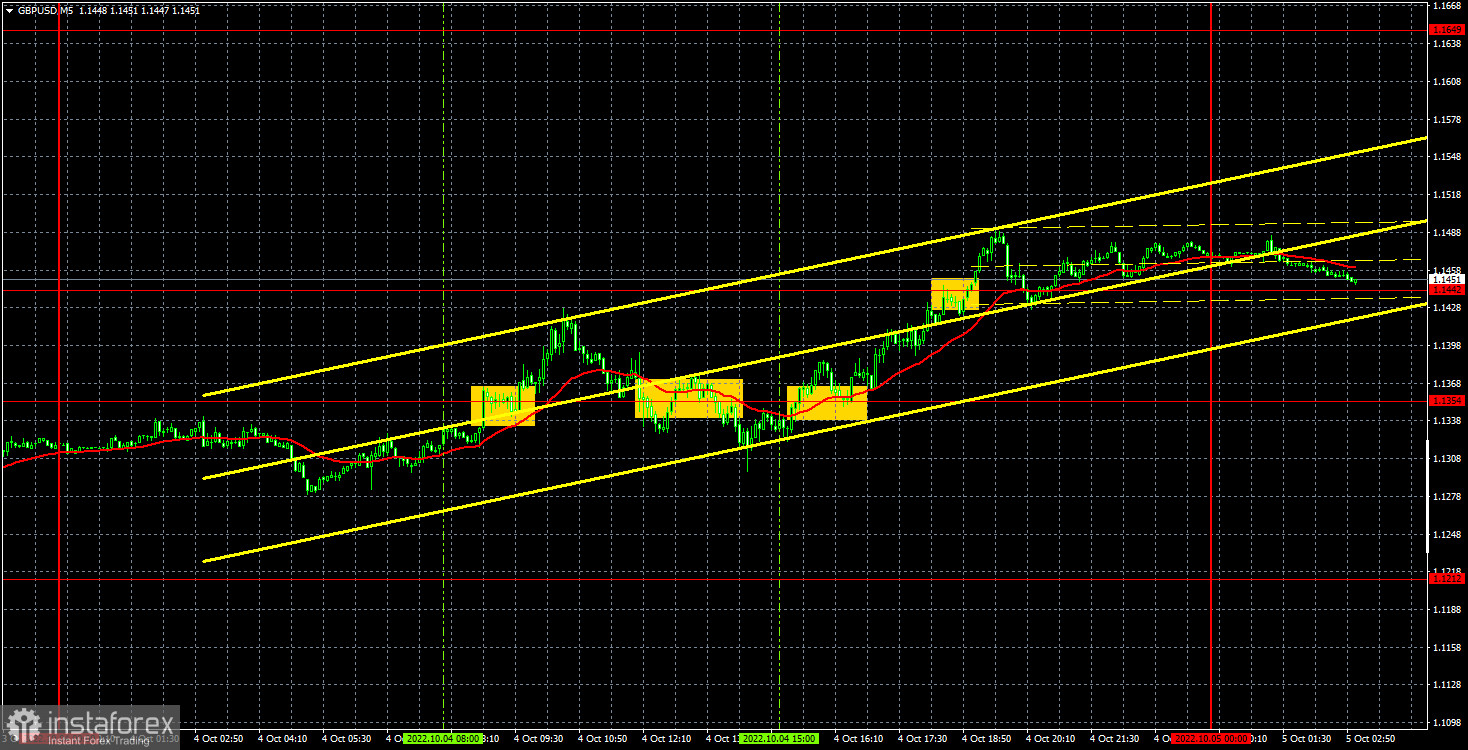
GBP/USD 5M
Yesterday, the GBP/USD currency pair continued its upward movement at about the same pace as it had recently fallen. That's how quickly everything changes in the foreign exchange market. Just a week ago, the pound was near the 1.0400 level, which is its all-time low, and now it is already 1100 points higher. We said that the downward trend should end quickly and sharply, it seems that this happened a week ago. Now it is very important for the pound that geopolitics and the "foundation" do not return the bears to the market. If from the foundation it is approximately clear what to expect in the coming months, then with geopolitics it is a big question. We assume that the military conflict in Ukraine may escalate more than once and definitely will not end in the coming months. Therefore, on each subsequent escalation, the dollar can rise again, because this is a normal defensive reaction of the market. Thus, the pound is still taking advantage of the fact that bears have taken profits on their transactions, but its long-term growth prospects still remain vague.
There were several trading signals on Tuesday, and the volatility was again high. The first three signals formed near the level of 1.1354. The first buy signal cannot be considered false, as the price went up 55 points and just barely reached the target level. The next sell signal turned out to be false, as the price went in the right direction by only 35 points. Therefore, most likely, traders did not receive any profit on the first two transactions. But the third buy signal made it possible to earn. The price reached the level of 1.1442 this time and overcame it. Therefore, the position had to be closed manually above this level, and the profit was at least 80-90 points.
COT report:
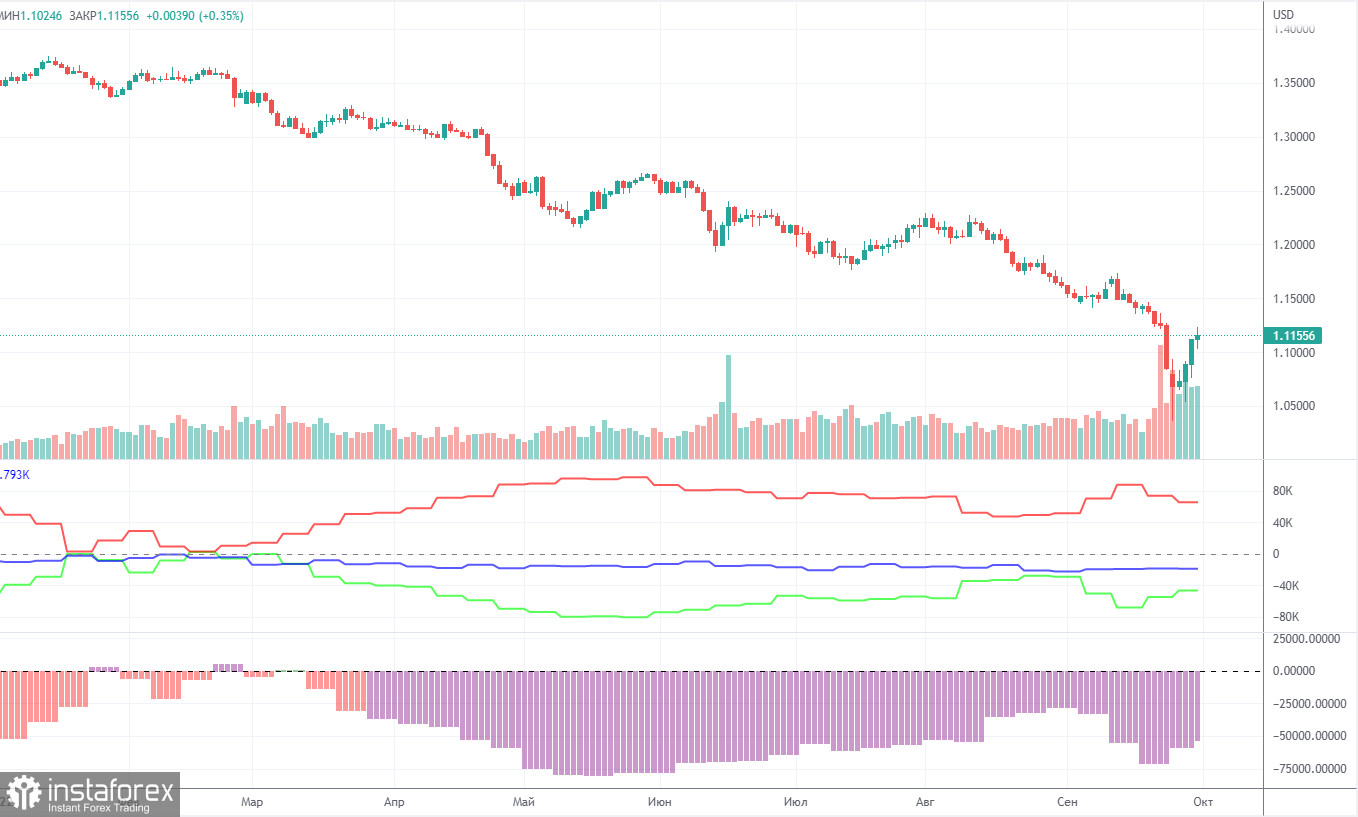
The latest Commitment of Traders (COT) report on the British pound was again very eloquent. During the week, the non-commercial group opened 18,500 long positions and 10,100 short positions. Thus, the net position of non-commercial traders increased by another 8,400, which is quite a lot for the pound. We could assume that the actions of the big players and the pound's movement have finally begun to coincide, only the report is released with a three-day delay and simply does not include the last three days of trading, when the pound showed growth. The net position indicator has been actively falling again in recent weeks, and the mood of the big players remains "pronounced bearish", which is clearly seen in the second indicator in the chart above (purple bars below zero = bearish mood). Now it has begun a new growth, so the British pound can formally count on growth. But, if we recall the situation with the euro, then there are big doubts that based on the COT reports, we can expect a strong growth of the pair. How can you count on it if the market buys the dollar more than the pound? The non-commercial group now has a total of 106,000 shorts and 59,000 longs open. The difference, as we can see, is still large. The euro cannot show growth if the major players are bullish, and the pound will suddenly be able to grow if the mood is bearish? We remain skeptical about the long-term growth of the British currency.
We recommend to familiarize yourself with:
Overview of the EUR/USD pair. October 5. The world is on the brink of a nuclear catastrophe. The stakes are going up.
Overview of the GBP/USD pair. October 5. There are opportunities to restore the work of Nord Stream.
Forecast and trading signals for EUR/USD on October 5. Detailed analysis of the movement of the pair and trading transactions.
GBP/USD 1H
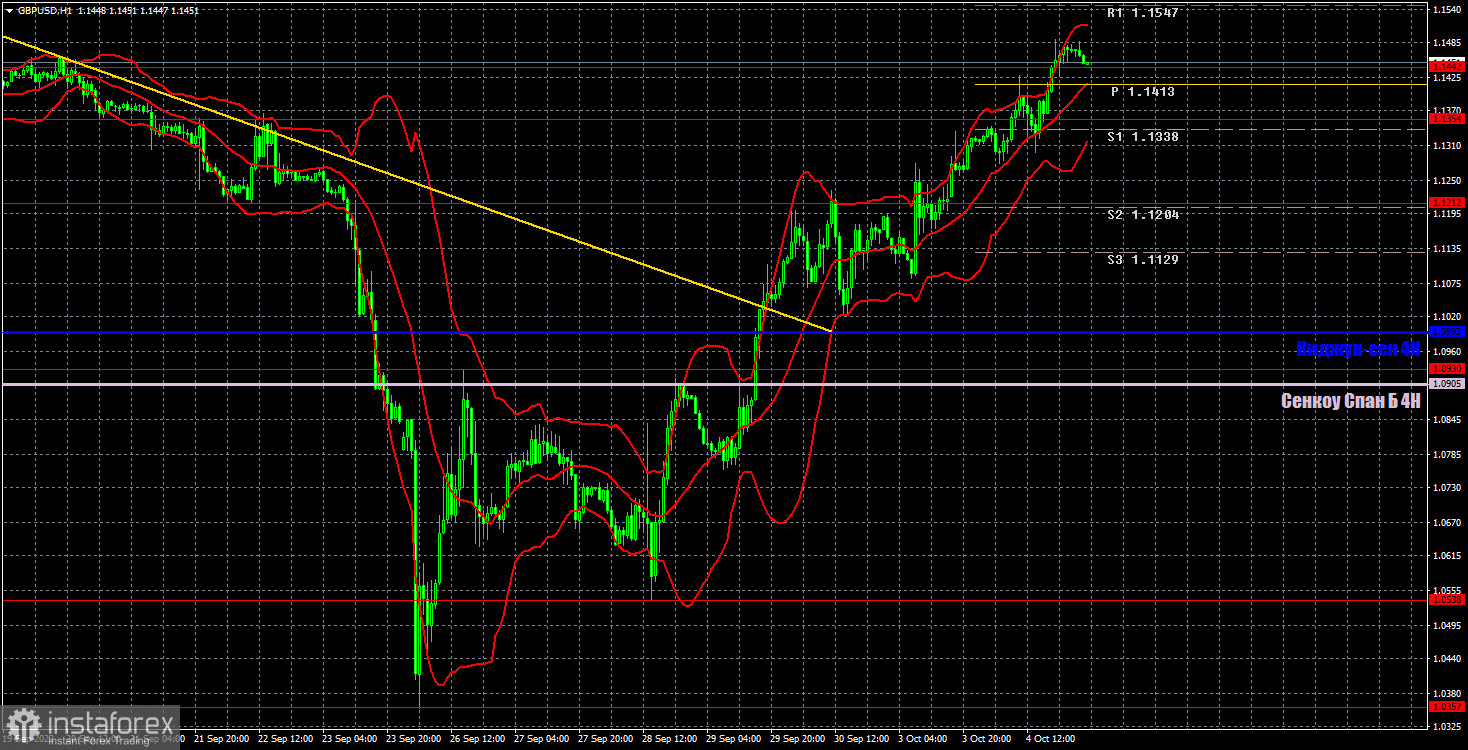
The pound/dollar pair has broken the downward trend on the hourly timeframe, as all key levels and lines have been overcome. Important lines and levels are also slowly overcome on the higher timeframes, so the pound is getting closer and closer every day to completing a long-term downward trend. So far, the fundamental and geopolitical backgrounds do not prevent the pound from growing, but in the future the situation may change more than once in favor of the dollar. We highlight the following important levels on October 5: 1.0930, 1.1212, 1.1354, 1.1442, 1.1649. Senkou Span B (1.0905) and Kijun-sen (1.0993) lines can also be sources of signals. Signals can be "rebounds" and "breakthroughs" of these levels and lines. The Stop Loss level is recommended to be set to breakeven when the price passes in the right direction by 20 points. Ichimoku indicator lines can move during the day, which should be taken into account when determining trading signals. The chart also contains support and resistance levels that can be used to take profits on positions. The UK and the US will publish indexes of business activity in the services sectors, and we have another ADP report in the US. This data may affect the pair's movement, but the market is now buying the pound and just fine for no reason.
Explanations for the chart:
Support and Resistance Levels are the levels that serve as targets when buying or selling the pair. You can place Take Profit near these levels.
Kijun-sen and Senkou Span B lines are lines of the Ichimoku indicator transferred to the hourly timeframe from the 4-hour one.
Support and resistance areas are areas from which the price has repeatedly rebounded off.
Yellow lines are trend lines, trend channels and any other technical patterns.
Indicator 1 on the COT charts is the size of the net position of each category of traders.
Indicator 2 on the COT charts is the size of the net position for the non-commercial group.