 English
  Русский
 Bahasa Indonesia
 Bahasa Malay
 ไทย
ไทย Español
 Deutsch
 Български
 Français
 Tiếng Việt
 中文
中文 বাংলা
বাংলা हिन्दी
 Čeština
 Українська
 Română

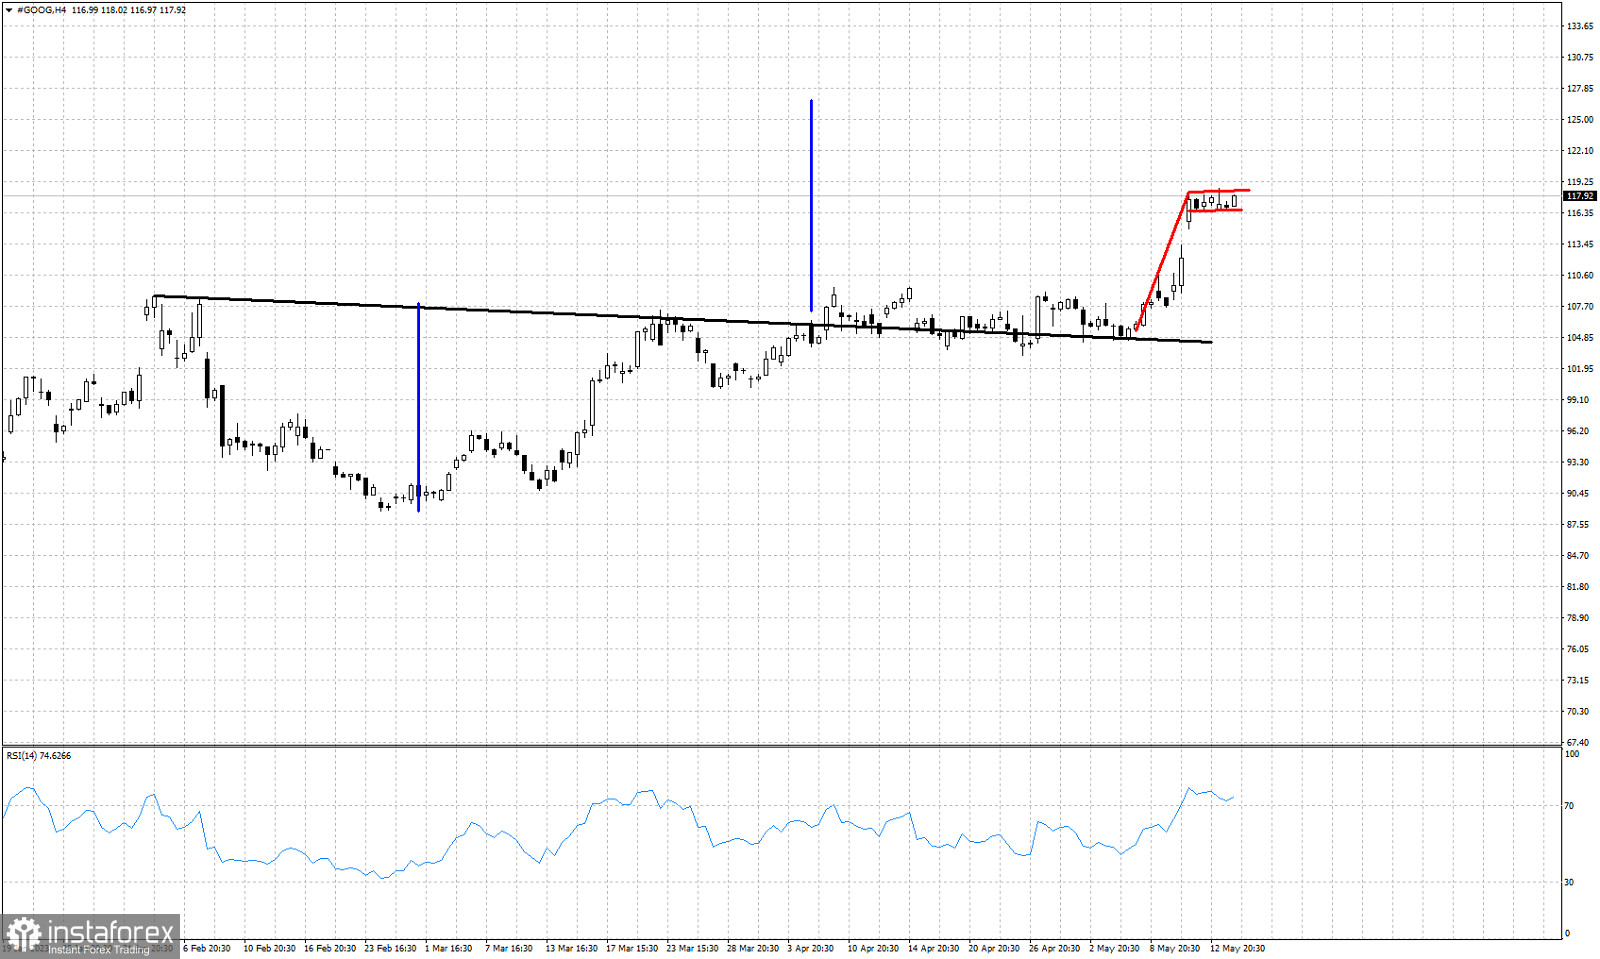
Black line -resistance
Blue lines- expected rise equal to height of cup
Red lines- bullish flag
At the beginning of April we discussed the bullish breakout of a cup and handle pattern in GOOG stock chart. Although price broke above the then recent high, price did not make any real progress until the last few days. Price continues to trade around the neck line resistance and at the beginning of May price broke out above it. Recent price action shows us that a bullish flag pattern has been formed. A break above $118.25 would be a new bullish signal. According to the cup and handle pattern there is plenty of upside potential for GOOG stock price towards $127. A bullish flag break out will be supportive of this scenario. Bulls do not want to see GOOG stock price fall below $105.