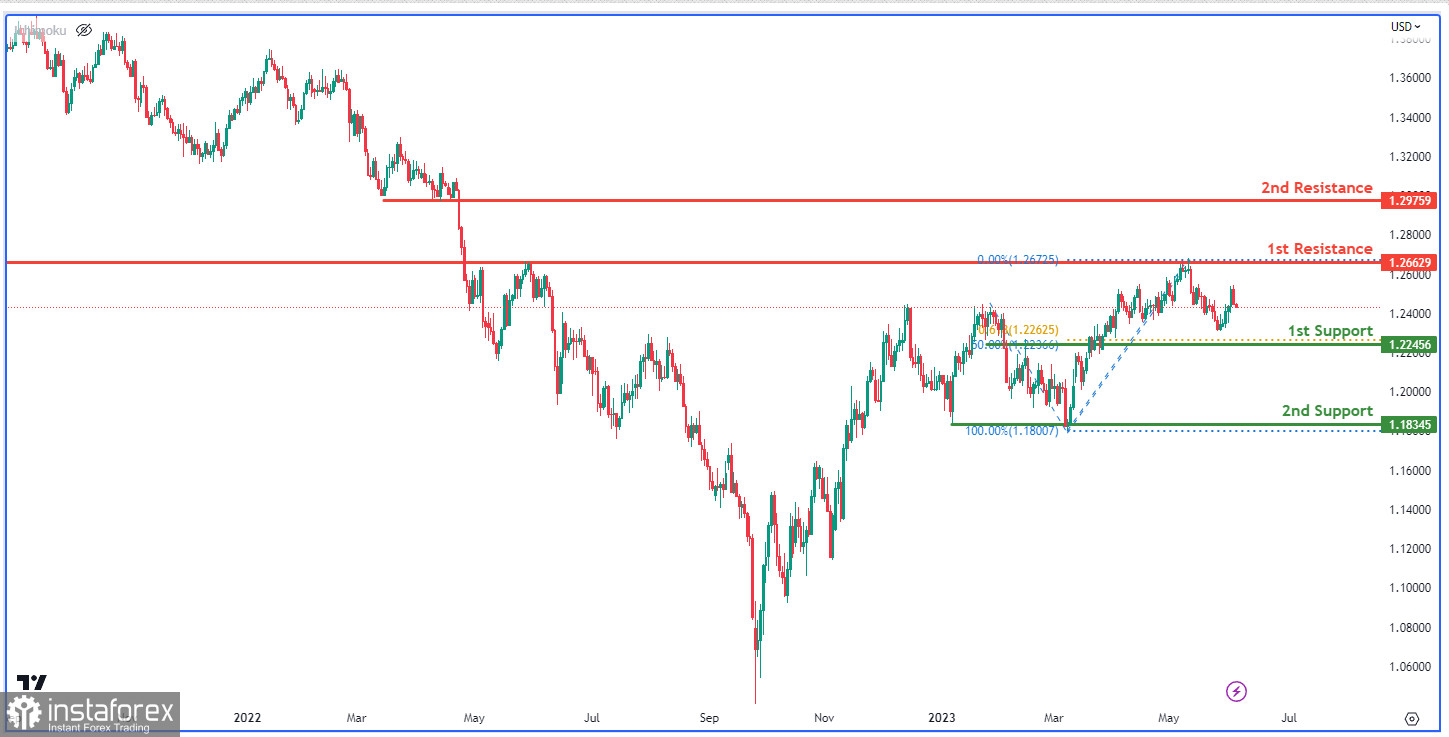
The GBP/USD chart currently shows a bearish momentum, indicating a downward trend. There is a possibility for the price to continue its bearish movement, targeting the first support level.
The first support at 1.2245 is a significant level, acting as an overlap support and coinciding with key Fibonacci levels, suggesting it could trigger market activity and a potential trend reversal. Further down, the second support at 1.1834 serves as a multi-swing low support, offering a strong defence against further price declines.
On the other hand, the first resistance at 1.2662 acts as an overlap resistance, potentially impeding upward price movement. Additionally, the second resistance at 1.2975 is identified as a pullback resistance, likely to pose a substantial barrier to upward momentum, attracting sellers into the market.

 English
 Русский
 Bahasa Indonesia
 Bahasa Malay
 ไทย
ไทย Español
 Deutsch
 Български
 Français
 Tiếng Việt
 中文
中文 বাংলা
বাংলা हिन्दी
 Čeština
 Українська
 Română

