 English
  Русский
 Bahasa Indonesia
 Bahasa Malay
 ไทย
ไทย Español
 Deutsch
 Български
 Français
 Tiếng Việt
 中文
中文 বাংলা
বাংলা हिन्दी
 Čeština
 Українська
 Română

Gold:
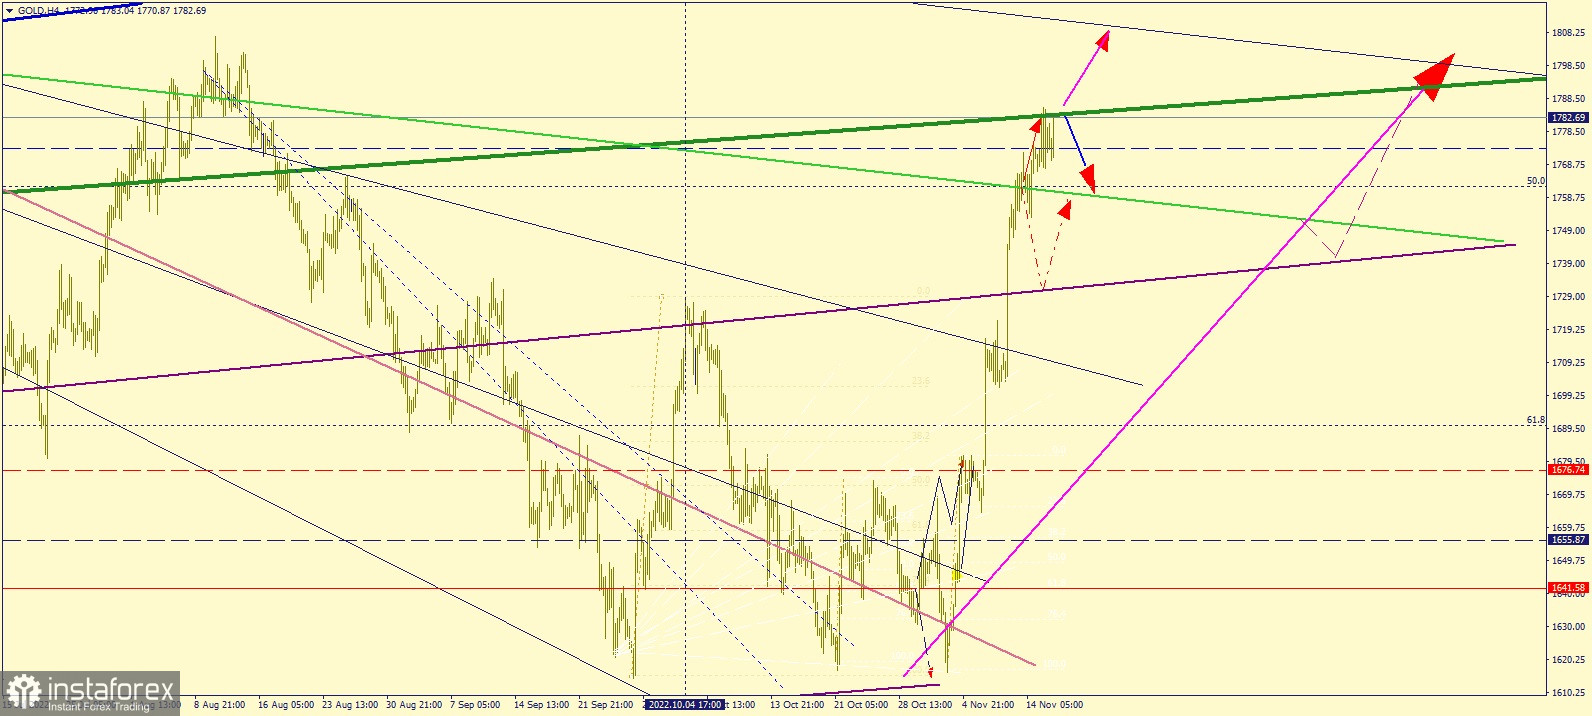
The chart shows the movement of #GOLD on the 4-hour chart (H4).
Quotes consolidated near the global dynamic level (slanted solid green line), settling at a value of $1783 per troy ounce. The breakdown of this level may push the metal to $1810. Otherwise, the bullish movement will end, prompting a correction to $1760.
Good luck!