 English
  Русский
 Bahasa Indonesia
 Bahasa Malay
 ไทย
ไทย Español
 Deutsch
 Български
 Français
 Tiếng Việt
 中文
中文 বাংলা
বাংলা हिन्दी
 Čeština
 Українська
 Română

Today's positive data from the US Census Bureau's retail sales report supported the dollar.
According to the data presented, retail sales rose +1.3% YoY in October, which was better than the forecast of +1.0% growth and the previous zero value.
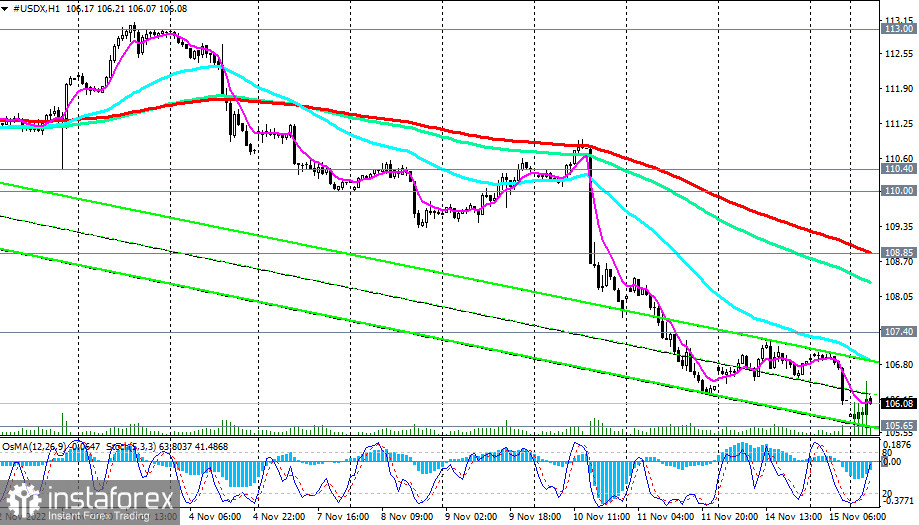
Dollar buyers perked up, but their optimism did not last long. The dollar index (DXY) reacted to this publication with only short-term and restrained growth.
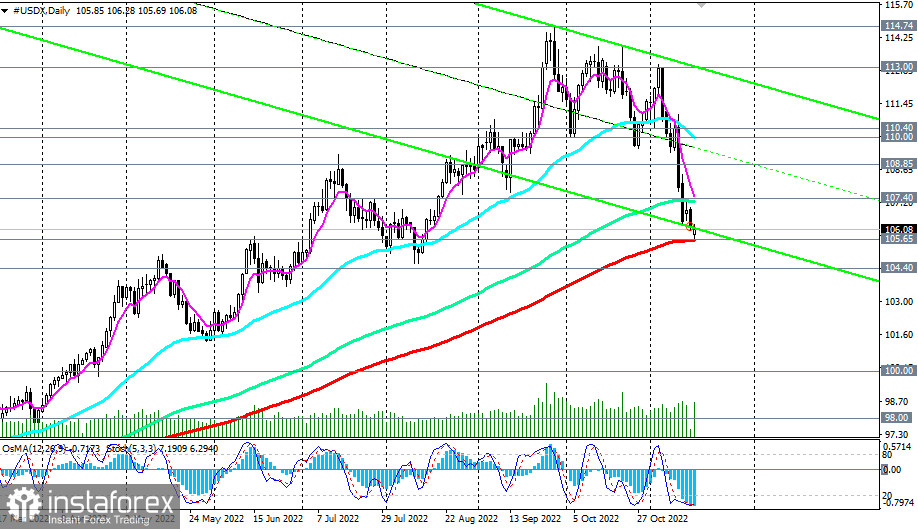
At the same time, today, the price touched the key support level 105.65 (200 EMA on the daily chart of CFD #USDX).
The dollar, and its DXY index, remains negatively affected by last week's weaker-than-expected US CPIs. If the consumer price index presents another surprise next month, pointing to the already downward trend in inflation in the US, then the next increase in the Fed's interest rate will not be 0.75%, but 0.50%, and maybe 0.25%. In this case, there will be conversations among market participants and signals from the sides of the Fed leaders on the possibility of a pause in the cycle of tightening monetary policy of the American central bank.
The dollar needs another strong bullish impulse, and it is unlikely to appear until the beginning of next month, when the November report of the US Department of Labor is released on Friday, December 2. It is difficult to overestimate the importance of this report for the further dynamics of the dollar. If the data point to a significant deterioration in the US labor market, then at least a slowdown in monetary policy tightening cannot be avoided. And this will be a strong negative factor for the dollar.
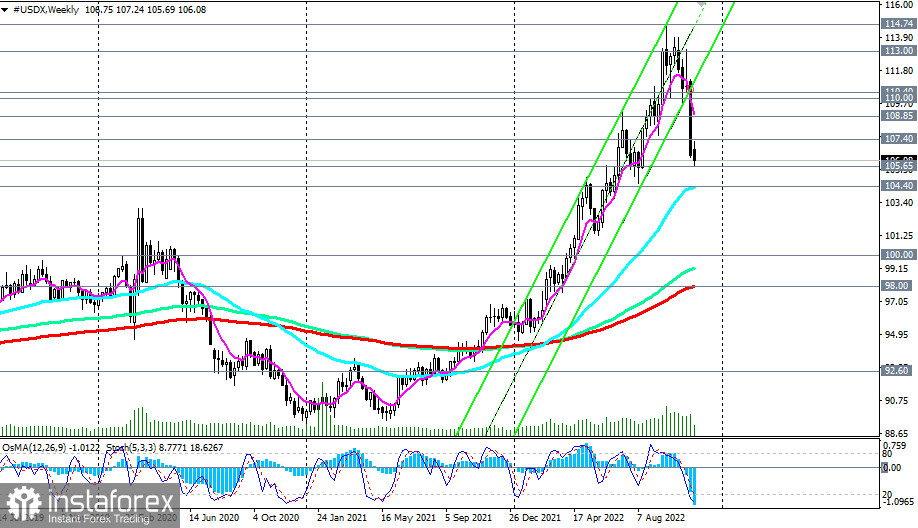
From a technical point of view, a breakdown of the support levels 105.65 and 104.40 (50 EMA on the weekly CFD #USDX chart) will open the way for the dollar index towards values of 100.00, 99.00, 98.00 (200 EMA on the weekly chart).
In an alternative scenario, the breakdown of the 107.40 resistance level (144 EMA on the daily chart) will be the first signal for the revival of the bullish dynamics of the dollar and CFD #USDX, and the confirmation will be the breakdown of the 108.85 resistance level (200 EMA on the 1-hour chart). The nearest growth target after that is resistance levels 110.00 (50 EMA on the daily chart), 111.00.
Support levels: 105.65, 105.00, 104.40
Resistance levels: 107.00, 107.40, 108.00, 108.85, 109.00, 110.00, 110.40, 111.00
Trading Tips
SellStop 105.50. Stop Loss 107.10. Take-Profit 105.00, 104.40, 100.00, 99.00, 98.00
Buy Stop 107.10. Stop-Loss 105.50. Take-Profit 107.40, 108.00, 108.85, 109.00, 110.00, 110.40, 111.00