 English
  Русский
 Bahasa Indonesia
 Bahasa Malay
 ไทย
ไทย Español
 Deutsch
 Български
 Français
 Tiếng Việt
 中文
中文 বাংলা
বাংলা हिन्दी
 Čeština
 Українська
 Română

EUR/USD
Analysis:
Since the end of September, an upward wave has been dictating the direction of price movement for the major pair of the European currency. This section replaces the correction of the previous trend decline on the daily scale of the chart. At the time of analysis, the wave structure needed to be completed. The long-range resistance shows the lower limit of the current wave's initial target zone.
Forecast:
The general direction of the euro's movement along the support zone is anticipated to continue at the start of the upcoming week. In the second half, activation and the start of the growth rate can be anticipated. The next price level will become accessible with a break of the nearby resistance.
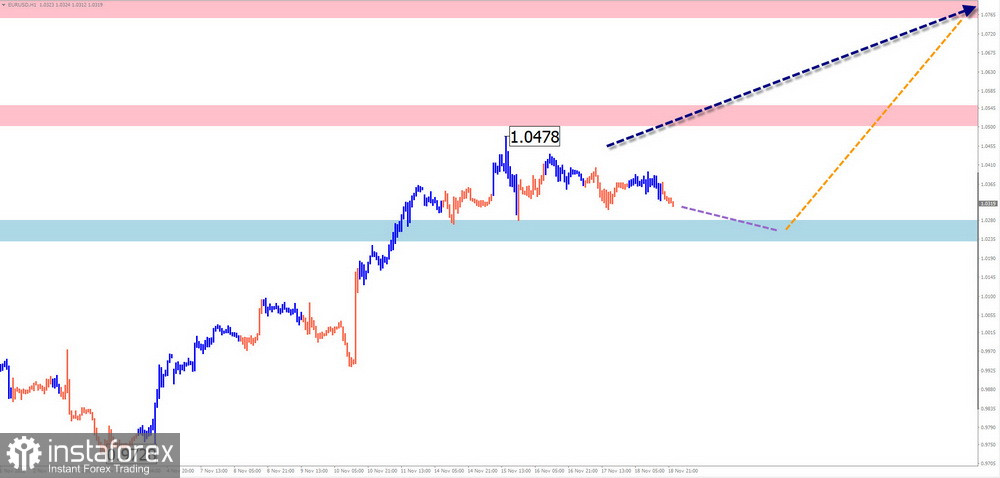
Potential zones for reversals
Resistance:
- 1.0760/1.0810;
- 1.0500/1.0550.
Support:
- 1.0280/1.0230.
Recommendations:
Sales: are highly risky and may result in losses;
Purchases: they are advised for trading transactions once the corresponding signals appear in the support zone.
USD/JPY
Analysis:
The main pair of Japanese yen quotes have formed a downward stretched plane on the chart since the fall. Since the events of November 11, quotes that are flattened outward form a countermovement. After the wave's potential reversal is confirmed in the form of a descending part (B), a new bullish wave will start.
Forecast:
The resistance zone will come under pressure from the price in the coming days. Furthermore, there is a high likelihood that a reversal will occur and the downward trend will resume. It is unlikely that the calculated support will be broken.
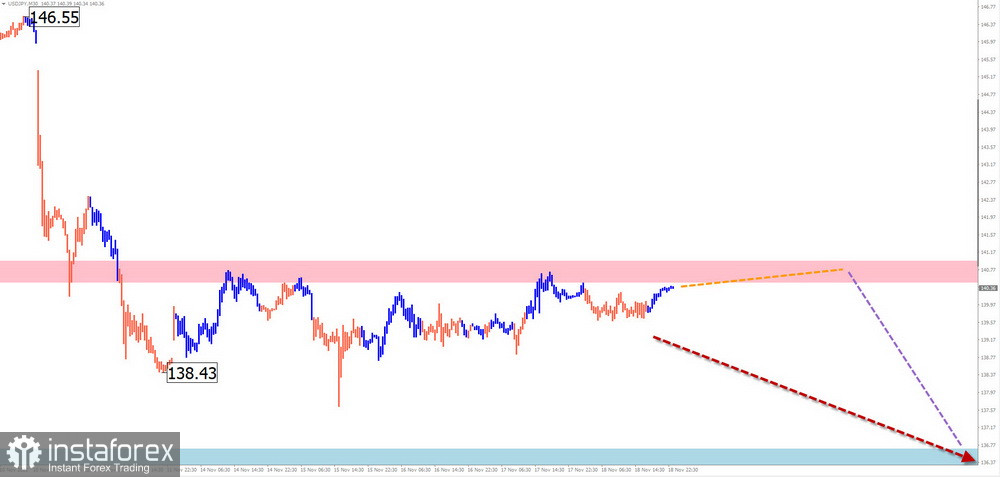
Potential zones for reversals
Resistance:
- 140.50/141.00.
Support:
- 136.70/136.20.
Recommendations:
Purchases: No conditions will apply to such transactions in the days to come;
Sales: After the pairs' reversing signals appear in the resistance zone area, they will become important.
GBP/JPY
Analysis:
The upward wave of September 26 continues to determine the short-term trend of the British pound/Japanese yen pair. Price along the strong resistance zone has formed the wave's corrective portion since mid-October. Its structure does not indicate completeness at the time of analysis.
Forecast:
The price is anticipated to reverse and repeatedly decline to the support area for the upcoming week, completing the upward course of movement in the area of the resistance zone. It's unlikely that prices will move past the settlement ranges this week.
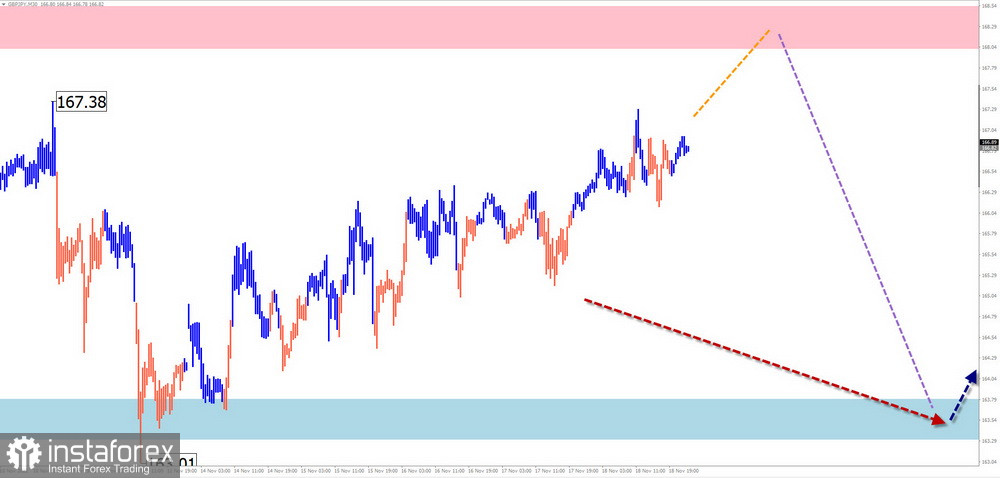
Potential zones for reversals
Resistance:
- 168.00/168.50.
Support:
- 163.80/163.30.
Recommendations:
Purchases: within specific sessions, fractional lots with the potential to reach the resistance zone will be available;
Sales: will start to matter when your trading systems detect reversal signals in the vicinity of the resistance zone.
USD/CAD
Analysis:
The September 26 downward wave algorithm determines the direction of the short-term trend of the Canadian dollar pair. At the time of analysis, the structure of this wave is incomplete. The quotes have been building up over the past week, forming an intermediate correction. The decline will continue once it is finished.
Forecast:
The general upward vector of price movement is anticipated to continue at the start of the upcoming week. Within the predicted resistance, the rise's end and the reversal are likely to occur. The likelihood of increased activity and a restart of price reductions increases by the end of the week.
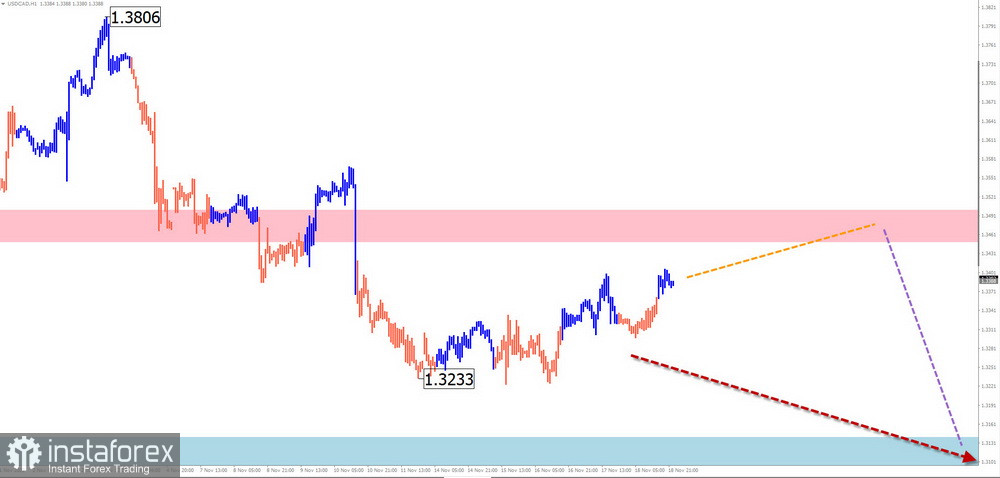
Potential zones for reversals
Resistance:
- 1.3450/1.3500.
Support:
- 1.3140/1.3090.
Recommendations:
Purchases: limited potential and potentially dangerous;
Sales: will start to matter once the signals from your trading systems confirm the reversal.
GOLD
Analysis:
The upward wave zigzag of September 28 determines the short-term direction of gold price movement. This section corrects the previous downward trend section on the chart's daily scale. The quotes are in a potential zone for a large-scale reversal, but the chart does not currently show any ready-made reversal signals. The price in this area has been falling over the past week.
Forecast:
Over the next few days, the number of quotes may drop. Pressure on the lower boundary of the support zone is possible up to the point of its short-term puncture. Following that, waiting for a lateral drift with the development of circumstances will be worthwhile to continue the upbeat mood. The instrument rate and volatility should increase as we get closer to the weekend.
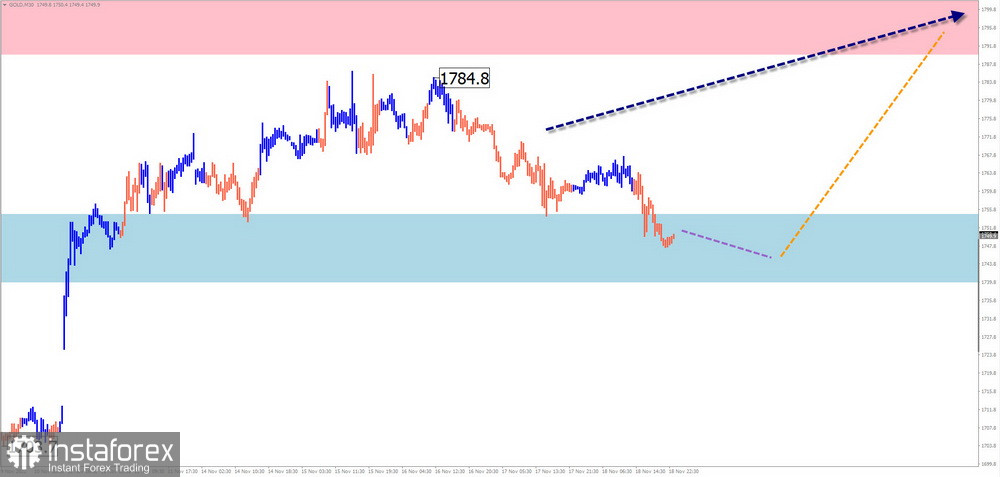
Potential zones for reversals
Resistance:
- 1790.0/1805.0.
Support:
- 1755.0/1740.0.
Recommendations:
Sales are high-risk due to their limited potential;
The appearance of confirmed reversal signals in the vicinity of the support zone will open the door to purchases. The potential for transactions constrains the resistance zones.
Explanations: In simplified wave analysis (UVA), each wave has three components. The final, incomplete wave is examined at each TF. The dotted line depicts the predicted movements.
Be aware that the wave algorithm needs to account for the instruments' temporal movement length!