 English
  Русский
 Bahasa Indonesia
 Bahasa Malay
 ไทย
ไทย Español
 Deutsch
 Български
 Français
 Tiếng Việt
 中文
中文 বাংলা
বাংলা हिन्दी
 Čeština
 Українська
 Română

GBP/USD
Brief analysis:
The ascending wave of September 26 has brought the pound to a strong reversal zone. The structure of the wave formed on November 3 is developing a final section (C). Within this section, the price was hovering in the sideways channel and then formed a pullback.
Weekly forecast:
In the coming days, the British pound is likely to be trading sideways near the support zone. In the second half of the week, the pair may reverse and resume the bullish trend. The estimated resistance level is located at the upper boundary of the weekly channel where the upside potential of the pound may be limited.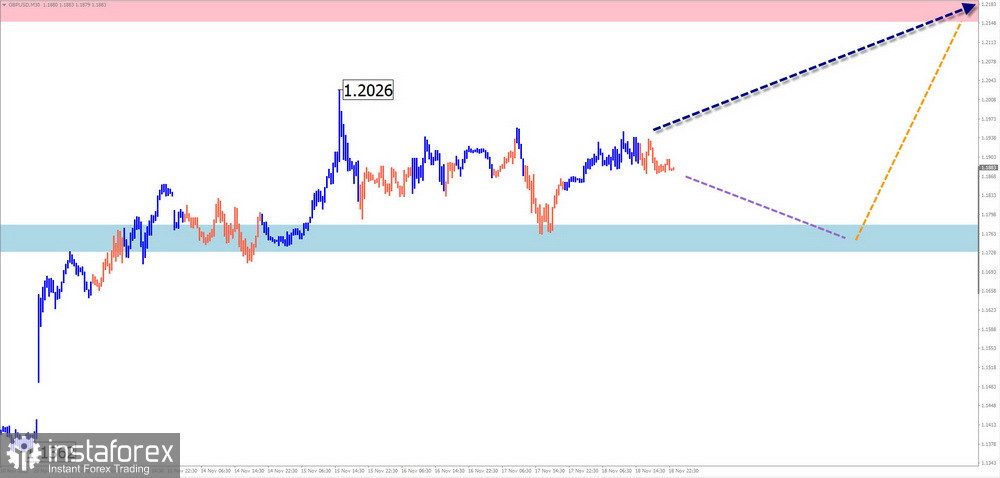
Potential reversal zones
Resistance:
- 1.2150/1.2200
Support:
- 1.1780/1.1730
Recommendations
Selling can be risky due to the low possibility of a downtrend.
Buying will be possible after confirmed reversal signals appear in the support zone.
AUD/USD
Brief analysis:
The AUD/USD pair continues the uptrend initiated in mid-October. On the daily chart, this wave section is going through a correction and is approaching a reversal. Yet, the wave is lacking the final section. The estimated resistance is found at the lower boundary of the assumed price channel.
Weekly forecast:
The downtrend may come to an end in the next few days. The price may reverse near the support zone and resume the upward movement. The highest trading activity on the pair is expected in the second half of the week.
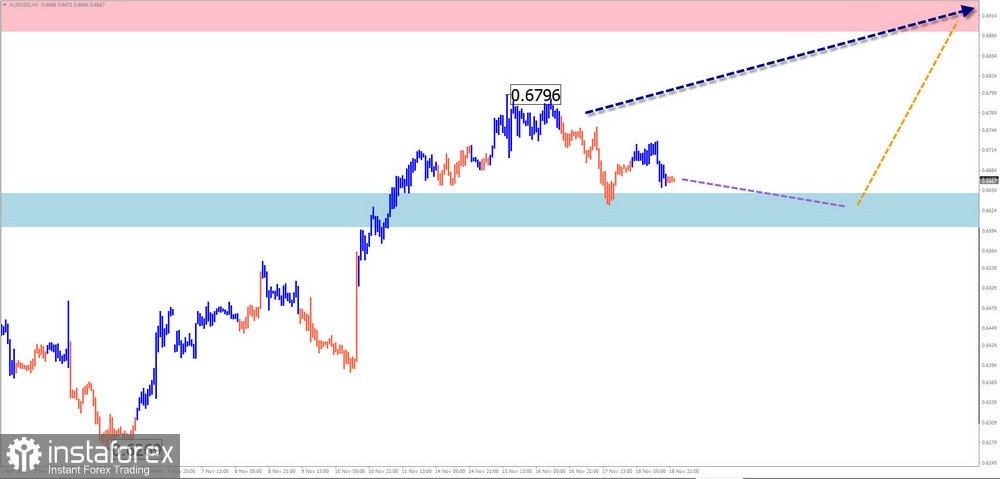
Potential reversal zones
Resistance:
- 0.6890/0.6940
Support:
- 0.6650/0.6600
Recommendations
Selling is not recommended in the coming week.
Buying may be possible after confirming signals appear in your trading system.
USD/CHF
Brief analysis:
On the USD/CHF chart, the ascending wave that has been forming since the middle of May is building a complex and prolonged descending section. Its structure looks complete by now. However, there are currently no signs on the chart signaling a reversal. The ascending section of the wave from the previous week has no reversal potential and stays within the current correction.
Weekly forecast:
The upside movement of the pair may be completed in the next day or two. Then a flat movement may start near the resistance area. At this point, the pair may change its direction. The price is likely to resume the decline by the end of the weekly session. The estimated support is viewed as a strong potential reversal zone on a higher time frame.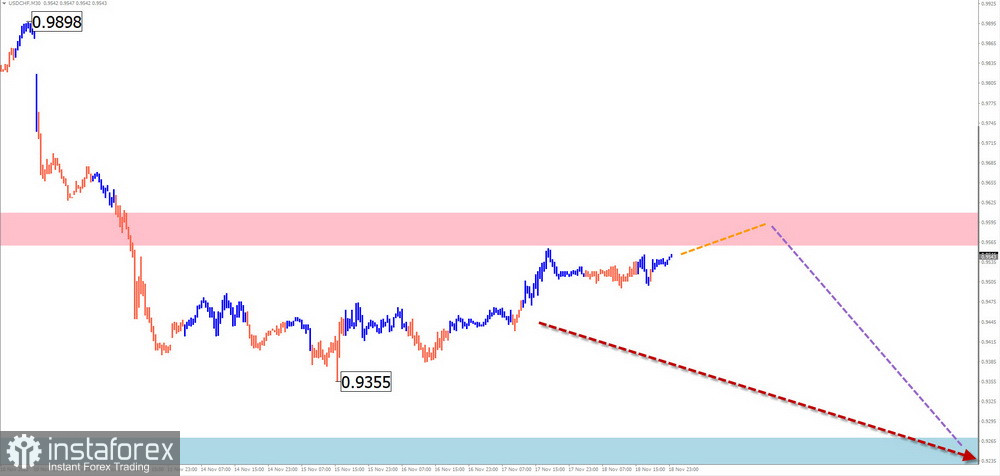
Potential reversal zones
Resistance:
- 0.9560/0.9610
Support:
- 0.9270/0.9220
Recommendations
Buying is not recommended in the coming days.
Selling can be done after confirming reversal signals appear near the resistance area.
EUR/JPY
Brief analysis:
The short-term trajectory of the euro/yen cross pair is determined by the ascending wave formed on September 26. Since October 17, the medium part of the wave (B) has been forming within the main wave. There are indications that this section is nearing its completion. However, there are currently no clear reversal signals.
Weekly forecast:
The pair may be moving in the sideways channel for the entire week. A downtrend is more likely in the first half of the week. The price may go no further than the support level. A reversal in the price direction may take place by the end of the week. The estimated resistance zone marks the upper limit of the price channel.
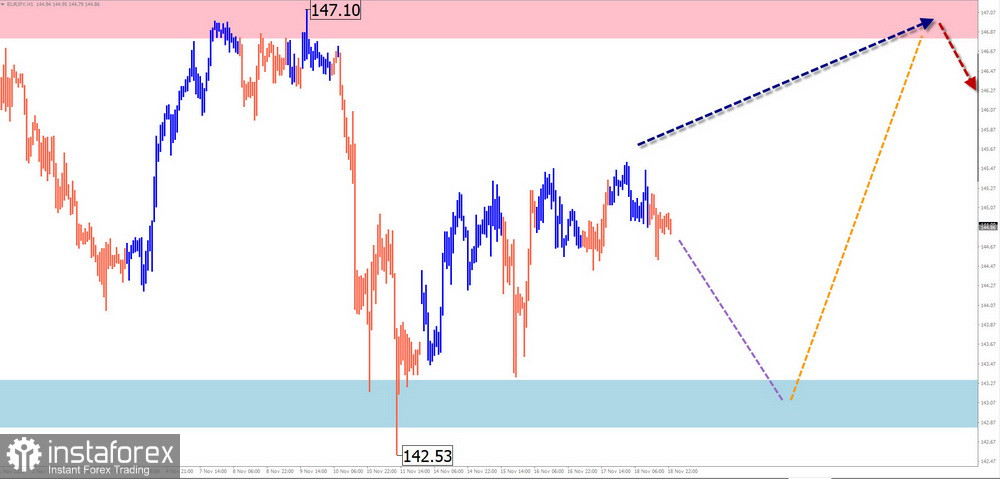
Potential reversal zones
Resistance:
- 146.80/147.30
Support:
- 143.30/142.80
Recommendations
Selling can be done only with fractional lots within certain sessions, keeping in mind a possible decline to the support area.
Buying will be possible after the formation of confirming reversal signals.
EUR/GBP
Brief analysis:
The short-term trajectory of the euro/pound cross pair is determined by the descending wave formed on September 26. Over the past month and a half, the price has been going through a correction and is now trading within a horizontal channel. This structure does not look complete yet.
Weekly forecast:
The pair is expected to trade in the sideways channel in the course of the week. In the first days of the week, the price may shortly rise to the resistance zone. Later in the week, the pair may resume the downtrend. The price is unlikely to perform a breakout of the resistance zone in the coming days.
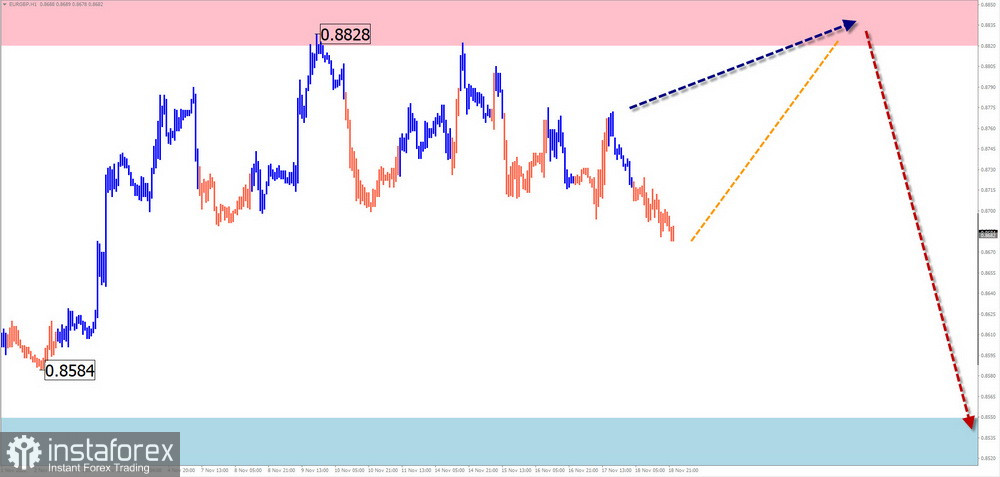
Potential reversal zones
Resistance:
- 0.6840/0.6890
Support:
- 0.6650/0.6600
Recommendations
Buying is risky and may result in losses.
Selling will become possible as soon as your trading system forms a reversal signal near the resistance area.
USDX
Brief analysis:
The US dollar has been trading in the bearish market since September 26. Its wave structure looks complete by now. The quote of the index has dropped to a strong support area which also serves as a reversal zone on the weekly time frame. Yet, there are currently no signals of an upcoming reversal. Last week, the quote performed an interim pullback along the upper line of the support level.
Weekly forecast:
The US dollar index is expected to continue in the first half of the week. Closer to the weekend, USDX may return to the bear market and decline towards the estimated support zone.
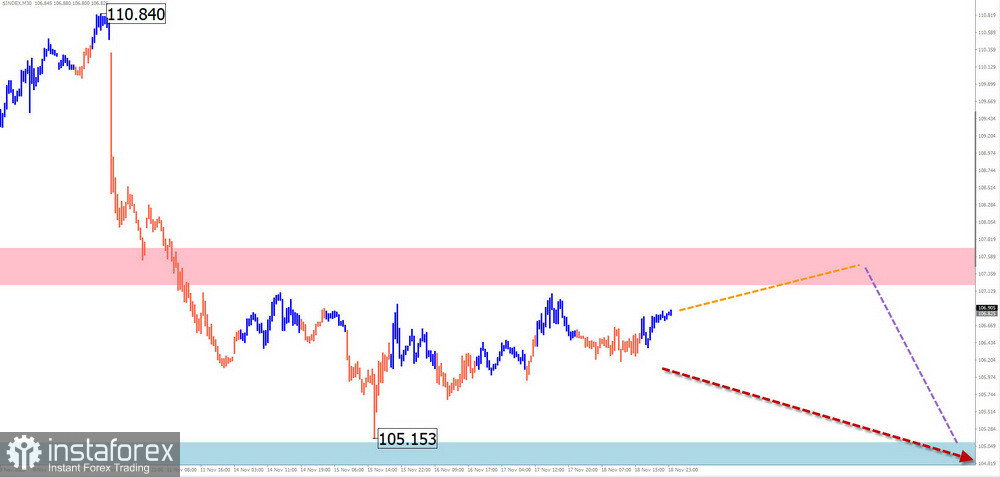
Potential reversal zones
Resistance:
- 107.20/107.70
Support:
- 105.10/104.60
Recommendations
Buying major pairs is advisable only after the formation of confirming reversal signals near the resistance zone.
Selling can be done with a small lot at the start of the week.
Explanation: In simplified wave analysis (SWA), the wave consists of 3 parts (A-B-C). We analyze the incomplete section of the wave for a certain time frame. The expected trajectory of the price is shown by the dotted line on the chart.
Note: the wave analysis does not take into account the movement of the instrument in time!