 English
  Русский
 Bahasa Indonesia
 Bahasa Malay
 ไทย
ไทย Español
 Deutsch
 Български
 Français
 Tiếng Việt
 中文
中文 বাংলা
বাংলা हिन्दी
 Čeština
 Українська
 Română

As noted in the previous review, the U.S. Census Bureau's report on retail sales, published last week with positive data, supported the dollar.
According to the data presented, retail sales rose +1.3% YoY in October, which was better than the forecast of +1.0% growth and the previous zero value.
Dollar buyers also perked up after the weekly data from the U.S. labor market was presented: the number of initial jobless claims increased by 222,000, which is lower than the forecast of an increase of 225,000 and the previous value of 226,000. The total number of Americans receiving unemployment benefits fell from 1.564 million to 1.526 million. Meanwhile, St. Louis Fed President James Bullard emphasized that there is a lot of work to be done before inflation rates reach target values. In his opinion, the earlier actions of the Fed have not yet led to a significant slowdown in inflation.
Either way, the dollar, while still modest, has resumed its upward momentum.
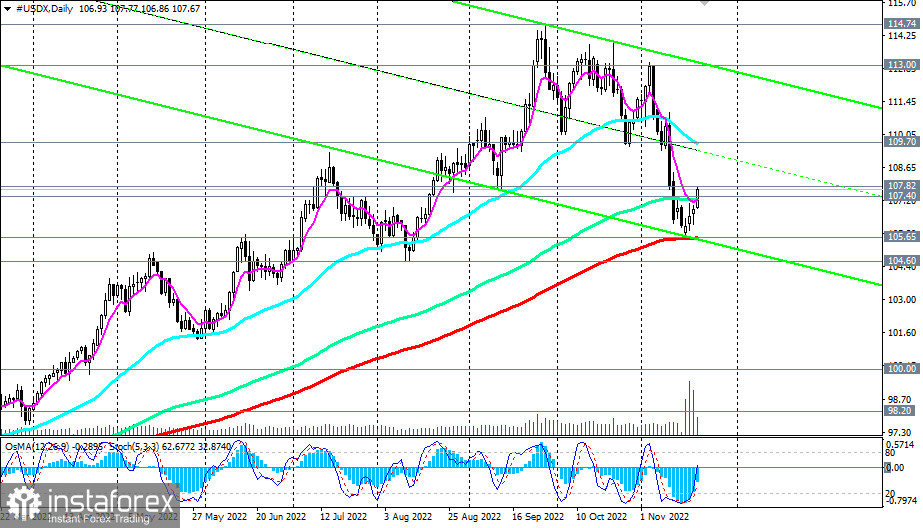
When buying signals emerge, long positions on the DXY will again become preferable. Now the first such signal is the return of the price above the resistance level of 107.40 (144 EMA on the daily chart).
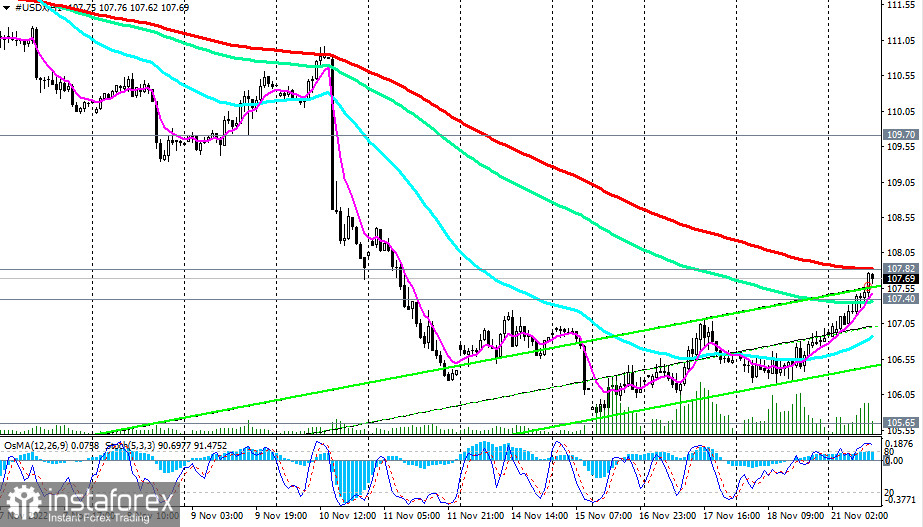
In the alternative scenario, the price will not be able to pass the important short-term resistance level 107.82 (200 EMA on the 1-hour chart). In case of a rebound from it and the resumption of the negative dynamics of DXY, the price will again fall below the support level of 107.40 and again head towards the key support level of 105.65 (200 EMA on the daily CFD #USDX chart).
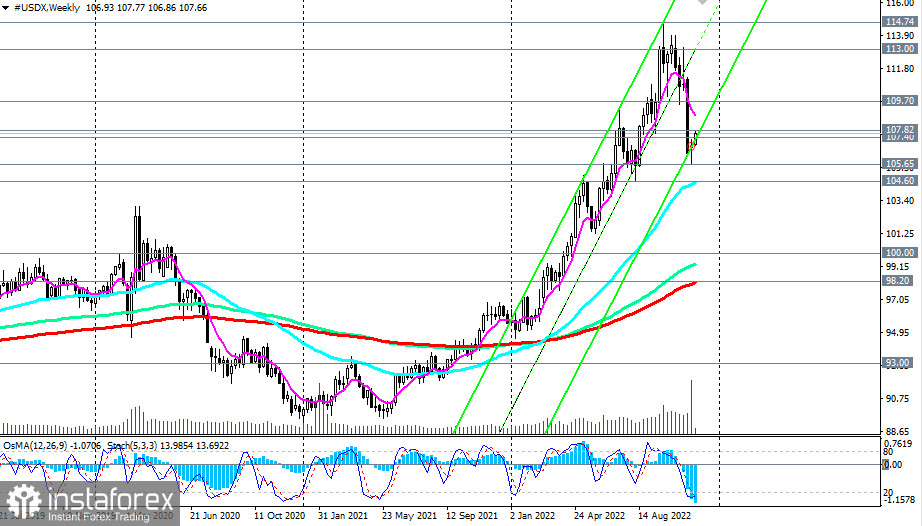
A breakdown of the support level at 104.60 could significantly worsen the prospects for the dollar and its DXY index, turning them into a bear market zone. While a breakdown of the key support level 98.20 (200 EMA on the weekly chart) will finally break the bullish trend of DXY.
So far, above the support levels of 105.65, 107.40, 107.00, long positions remain preferable. The immediate growth target after the breakdown of the resistance level of 107.82 is the resistance levels of 109.70 (50 EMA on the daily chart), 110.00.
Support levels: 107.40, 107.00, 106.85, 106.00, 105.65, 105.00, 104.60
Resistance levels: 107.82, 108.00, 109.00, 109.70, 110.00, 111.00, 113.00
Trading Tips
Sell Stop 106.80. Stop Loss 107.90. Take-Profit 106.00, 105.65, 105.00, 104.60
Buy Stop 107.90. Stop-Loss 106.80. Take-Profit 108.00, 109.00, 109.70, 110.00, 111.00, 113.00