 English
  Русский
 Bahasa Indonesia
 Bahasa Malay
 ไทย
ไทย Español
 Deutsch
 Български
 Français
 Tiếng Việt
 中文
中文 বাংলা
বাংলা हिन्दी
 Čeština
 Українська
 Română

Economic calendar on November 22
In terms of macro releases, Tuesday with its empty macroeconomic calendar was no different from Monday.
In this light, investors and traders will focus on the news stream.
Overview of technical charts on November 22
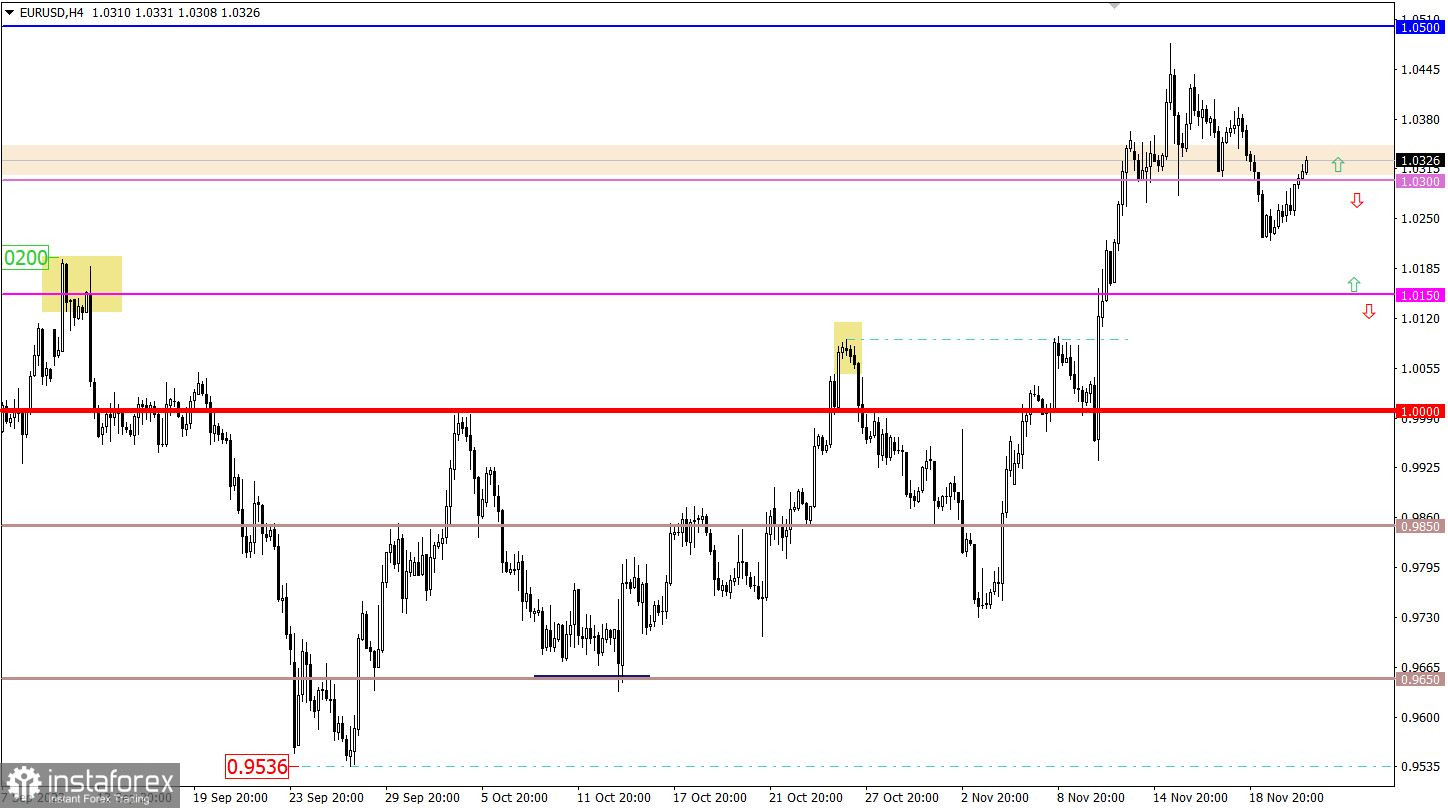
The EUR/USD slowed its corrective movement on the way to 1.0220 from the support level of 1.0500. Eventually, the quote rebounded to 1.0300, which indicates a partial recovery in the euro after the recent correction.
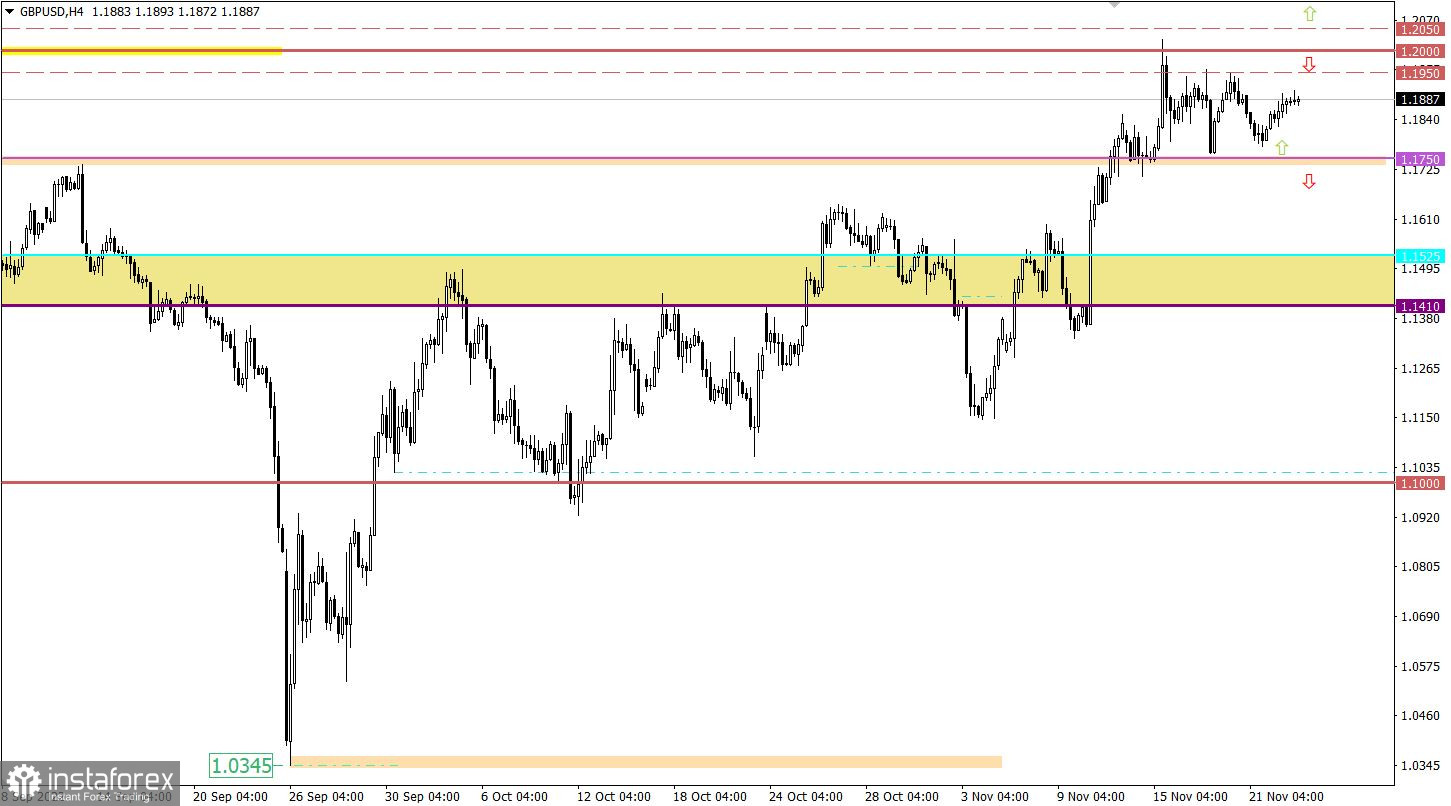
The GBP/USD pair has traded sideways in the range between 1.1750 and 1.1950 for a week. Despite a relatively wide channel, it is still a horizontal movement that emerged during the uptrend from the low.

Economic calendar on November 23
Today, the release of preliminary data on business activity may trigger an increase in trading activity. In the eurozone and the United Kingdom, all the indices are estimated to fall. Meanwhile, in the United States, the figures are forecast to somewhat increase.
Notably, the United States will deliver jobless claims statistics on Wednesday this time due to a federal holiday on Thursday. The reading is projected to show further growth, which is seen as a negative factor for the US jobs market.
United States Weekly Jobless Claims:
Continuing jobless claims are set to rise to 1,315,000 from 1,507,000.
Initial jobless claims are likely to grow to 224,000 versus 222,000.
Trading plan for EUR/USD on November 23
If the quote settles above 1.0300, EUR/USD may recover and test the November high.
At the same time, should the price fall below 1.0300 and consolidate on the daily chart, the corrective movement may extend.
Trading plan for GBP/USD on November 23
Under current circumstances, the pair is trading within the outlined range. Thus, the breakout strategy where the price bounces from one of the barriers of the sideways channel should be temporarily applied. In turn, this may show the pair's further direction.
Final thoughts:
Traders should apply the upward scenario and a breakout strategy if the price settles above 1.2050 on the 4-hour chart. This price action means at least that the flat market is over but could also signal a trend reversal.
The downward scenario will play out in case the corrective movement is prolonged from the psychological level. Then, the current flat market will benefit the sellers. To see this scenario in practice, the price should settle firmly below 1.1750 which will increase the sellers' chance for a further decline in GBP/USD.
What's on technical charts
The candlestick chart shows graphical white and black rectangles with upward and downward lines. While conducting a detailed analysis of each individual candlestick, it is possible to notice its features intrinsic to a particular time frame: the opening price, the closing price, and the highest and lowest price.
Horizontal levels are price levels, in relation to which a stop or reversal of the price may occur. They are called support and resistance levels.
Circles and rectangles are highlighted examples where the price reversed in the course of its history. This color highlighting indicates horizontal lines which can exert pressure on prices in the future.
Upward/downward arrows signal a possible future price direction.