 English
  Русский
 Bahasa Indonesia
 Bahasa Malay
 ไทย
ไทย Español
 Deutsch
 Български
 Français
 Tiếng Việt
 中文
中文 বাংলা
বাংলা हिन्दी
 Čeština
 Українська
 Română

#GOLD:
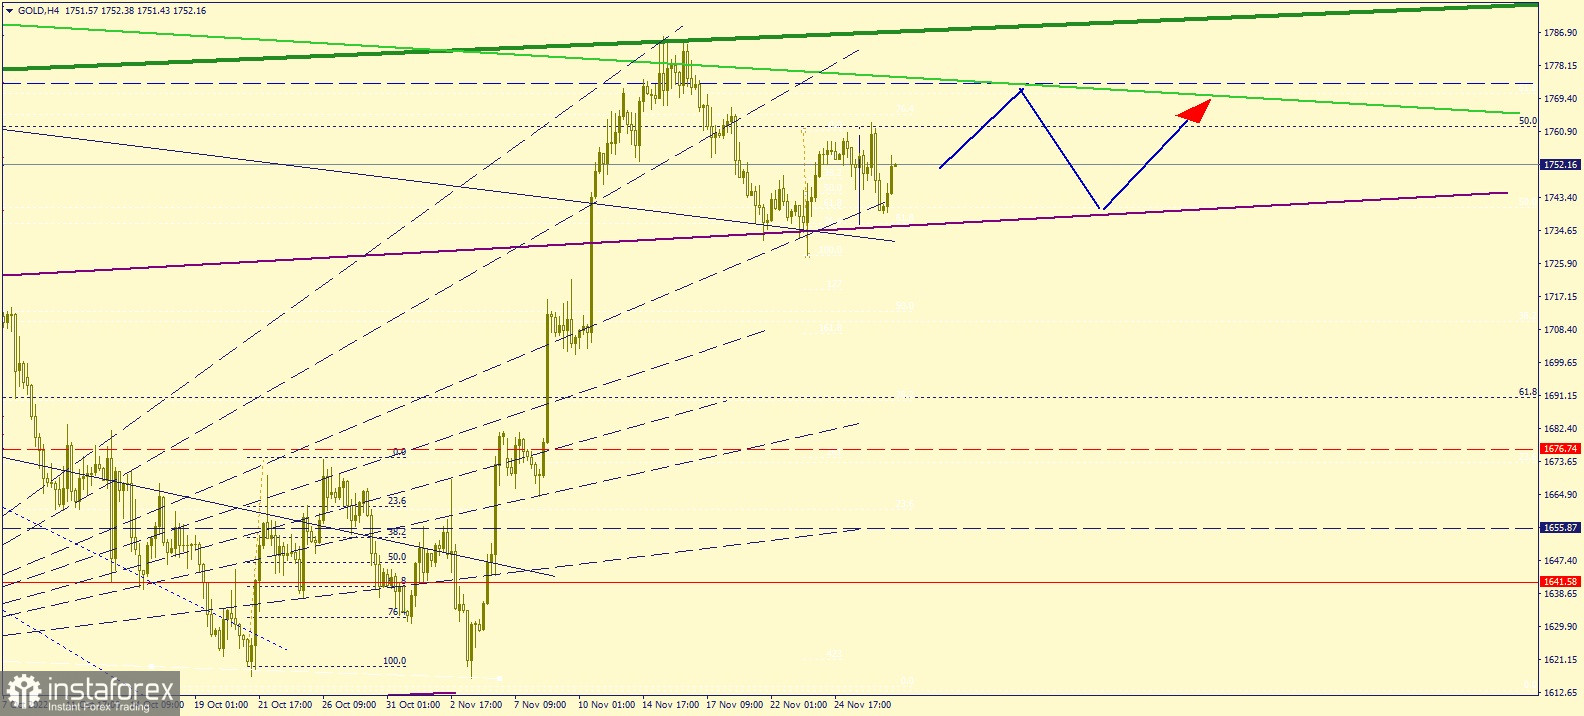
The chart shows the movement of gold on the 4-hour (H4) chart.
The metal reached the support level of $1733.0, then reversed towards $1775.0. There is a high chance that it will continue to trade sideways next week, as shown in the chart above.
Good luck!