 English
  Русский
 Bahasa Indonesia
 Bahasa Malay
 ไทย
ไทย Español
 Deutsch
 Български
 Français
 Tiếng Việt
 中文
中文 বাংলা
বাংলা हिन्दी
 Čeština
 Українська
 Română

Analyzing trades on Tuesday:
EUR/USD on 30M chart
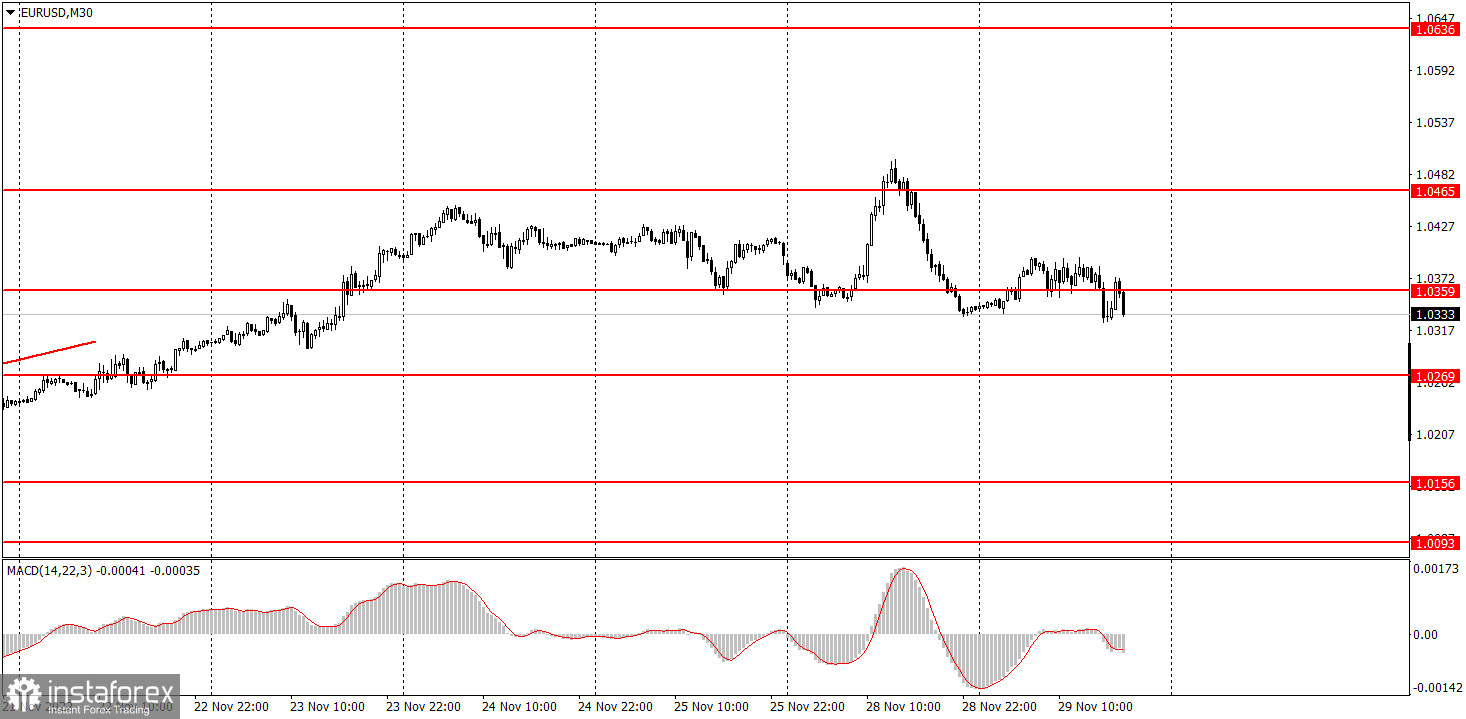
Yesterday, EUR/USD traded much more quietly than it did on Monday. Since there was no macroeconomic and fundamental background, traders could use news and events. But there wasn't any of that either. That's why Tuesday's volatility was only 70 pips, which was way below the average, and there was no movement. Even after it climbed to 1.0465 and tried to continue the upward movement, I still expect a strong bearish correction. We have been talking about it for more than a week, but what can we do if the market still refuses to buy the dollar right now. The fundamental background from the last couple of days enabled the dollar to rise. The technical picture allows a downward correction. However, the market waits. It is possibly waiting for Federal Reserve Chairman Jerome Powell's speech or Friday's Nonfarm Payrolls report. And these events can push the dollar to fall, but I still look at the fall as the main option.
EUR/USD on M5 chart
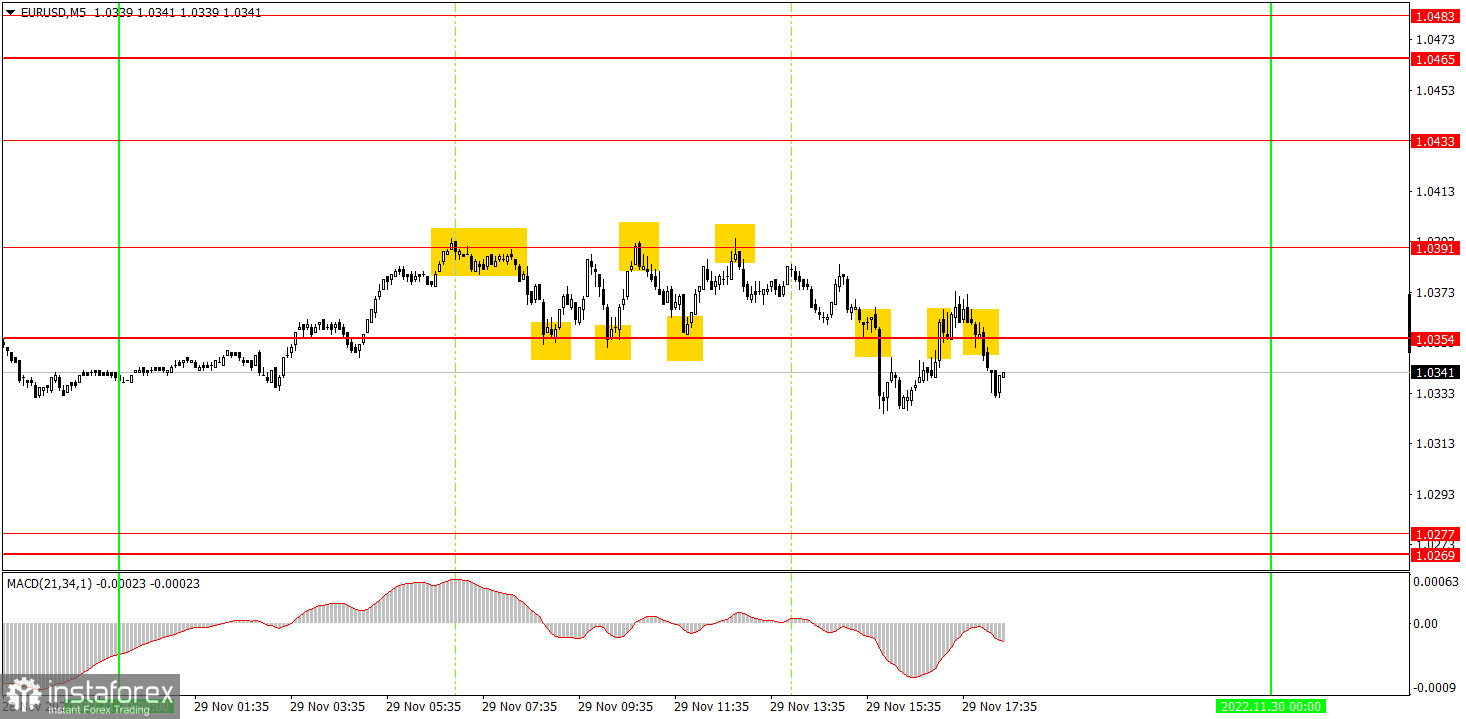
It is perfectly visible on the 5-minute chart that there was no trend on Tuesday. The price was moving solely between 1.0354 and 1.0391 during the European session. These levels couldn't be considered a wide range, but when the signal formed inside it, the price immediately went near the opposite level. Therefore, it was possible to put 50 pips between them, so there was no point in analyzing each signal because they were all the same. Only the last bounce from 1.0391 caused a sharp fall, and the price even stopped below 1.0354, but soon it returned to the area above that level, so the short position was closed with the same 10 pips as the last four trades. You could have gotten a loss on the last buy signal. Therefore, beginners could gain 20-30 pips in total on Tuesday, which is not bad for the flat.
Trading tips on Wednesday:
The uptrend has been canceled on the 30-minute time frame, but it may resurface. The pair is gravitating towards growth, but there is no ascending trend line anymore. We witnessed both equally strong growth and decline. In my opinion, the technical picture is very confusing right now. On the 5-minute chart on Wednesday, it is recommended to trade at the levels of 1.0156, 1.0221, 1.0269-1.0277, 1.0354, 1.0391, 1.0433, 1.0465-1.0483, 1.0535. As soon as the price passes 15 pips in the right direction, you should set a Stop Loss to breakeven. Today, three rather important reports will be published and Powell will also deliver a speech. In Europe, we will pay attention to the inflation data for November, in America, we will pay attention to the ADP and GDP reports. Each of them may provoke a reaction, but the most important ones will be European inflation and Powell's speech.
Basic rules of the trading system:
1) The strength of the signal is determined by the time it took the signal to form (a rebound or a breakout of the level). The quicker it is formed, the stronger the signal is.
2) If two or more positions were opened near a certain level based on a false signal (which did not trigger a Take Profit or test the nearest target level), then all subsequent signals at this level should be ignored.
3) When trading flat, a pair can form multiple false signals or not form them at all. In any case, it is better to stop trading at the first sign of a flat movement.
4) Trades should be opened in the period between the start of the European session and the middle of the US trading hours when all positions must be closed manually.
5) You can trade using signals from the MACD indicator on the 30-minute time frame only amid strong volatility and a clear trend that should be confirmed by a trendline or a trend channel.
6) If two levels are located too close to each other (from 5 to 15 pips), they should be considered support and resistance levels.
On the chart:
Support and Resistance levels are the levels that serve as targets when buying or selling the pair. You can place Take Profit near these levels.
Red lines are channels or trend lines that display the current trend and show in which direction it is better to trade now.
The MACD indicator (14, 22, and 3) consists of a histogram and a signal line. When they cross, this is a signal to enter the market. It is recommended to use this indicator in combination with trend patterns (channels and trendlines).
Important announcements and economic reports that can be found on the economic calendar can seriously influence the trajectory of a currency pair. Therefore, at the time of their release, we recommend trading as carefully as possible or exiting the market in order to avoid sharp price fluctuations.
Beginners on Forex should remember that not every single trade has to be profitable. The development of a clear strategy and money management is the key to success in trading over a long period of time.