 English
  Русский
 Bahasa Indonesia
 Bahasa Malay
 ไทย
ไทย Español
 Deutsch
 Български
 Français
 Tiếng Việt
 中文
中文 বাংলা
বাংলা हिन्दी
 Čeština
 Українська
 Română

Analyzing trades on Tuesday:
GBP/USD on 30M chart
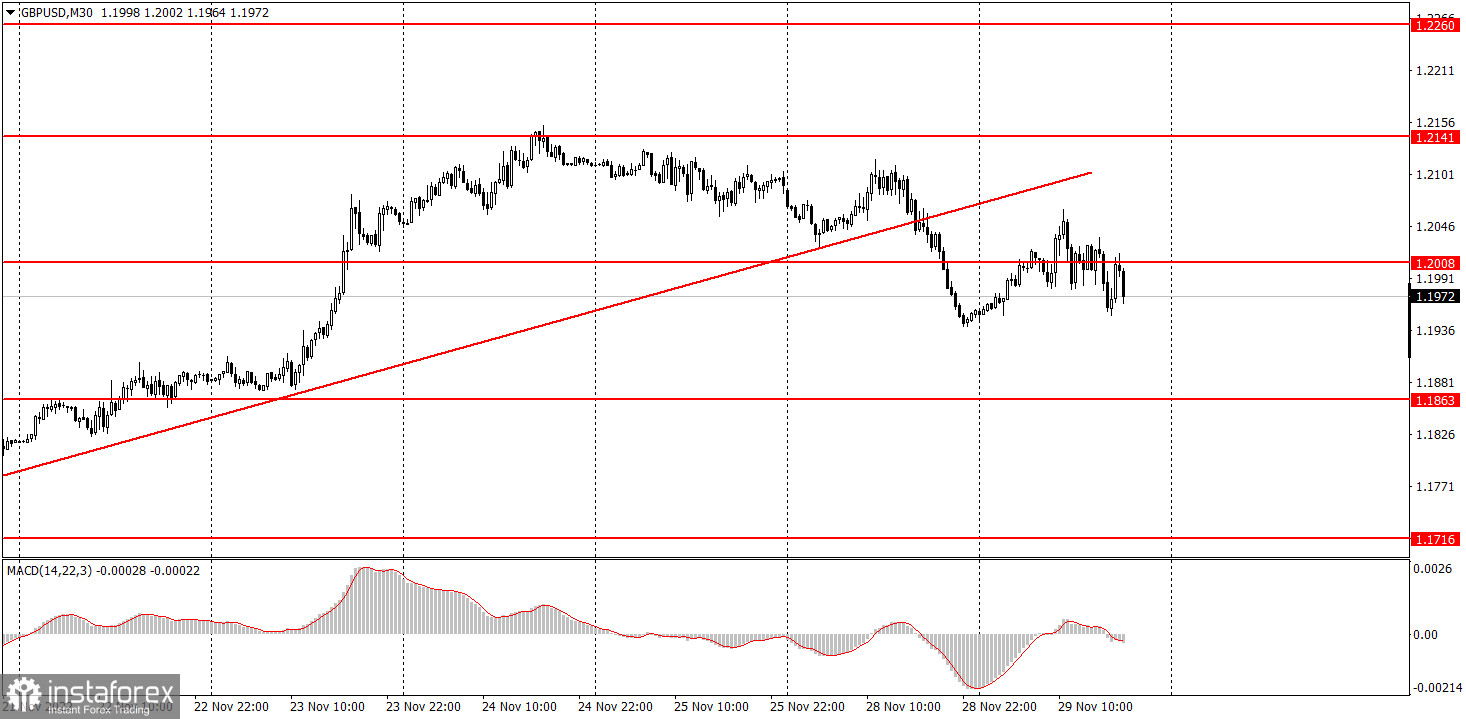
GBP/USD trade did not show any interesting movement on Tuesday. Volatility was around 120 pips, which is not that small for an empty day. Therefore, the pound was more active than the euro. Accordingly, its movements were also more appealing. Yesterday, the pair settled below the ascending trend line, so we expect the pound to fall. We anticipated it even before the pound settled, now nothing has changed. There were no important events and reports in the UK and US on Tuesday, but Wednesday has a lot to offer. Therefore, the second half of the week may be more active and volatile than the first half. We still believe that the pound has more room to rise in the medium term, but at the same time, it cannot move up all the time. It needs corrections from time to time, and we're waiting for one now.
GBP/USD on M5 chart
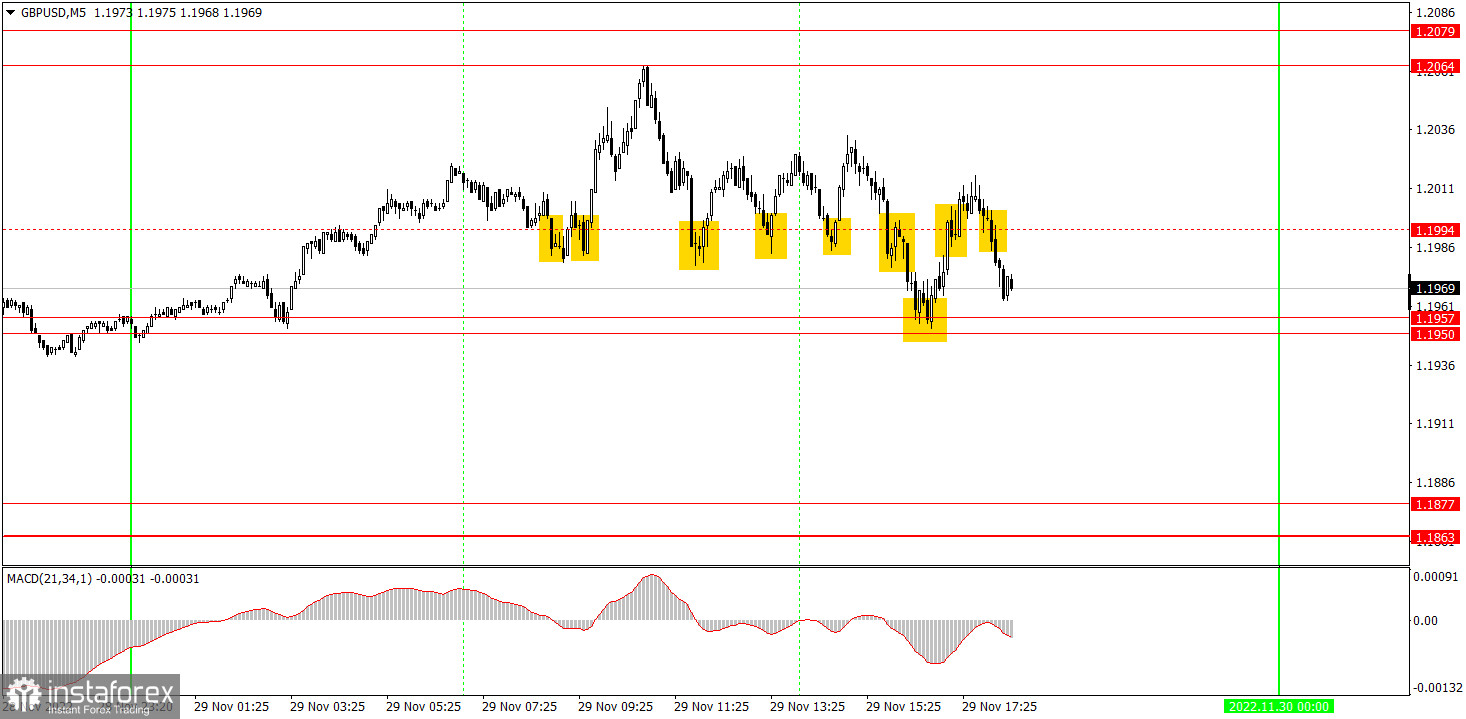
On the 5-minute chart, we can clearly see that the movement on Tuesday can not be considered as flat, but at the same time, we observed a flat for most of the day. The same thing applies for the euro. Almost all the trading signals were formed near 1.1994, which was considered irrelevant by the end of the day. Moreover, each of these signals was so inaccurate that it was hard to say whether it was a buy or sell signal. Thus, it was inconvenient to trade on Tuesday. In any case, beginners had to try to work out the first two signals near 1.1994, both turned out to be false. They could get a small loss on the first short position, then a Stop Loss at breakeven worked on the second long position since the price passed with the necessary 20 pips in the right direction. All further signals around 1.1994 should not have been processed. You could try to open a position on the signal around 1.1957, but it wouldn't make much profit. However, it would have covered the loss on the first position, so in that sense, it is considered profitable. As a whole, the day ended without us making any profit, which is very good if you consider the pair's movement.
Trading tips on Wednesday:
The pair finally has an opportunity to break the uptrend on the 30-minute time frame. Since the price finally settled below the trend line, we can now expect a downtrend. I already expected a sharp downtrend as early as last week, now both currency pairs can initiate it. On the 5-minute chart on Wednesday, it is recommended to trade at the levels 1.1793, 1.1863-1.1877, 1.1950-1.1957, 1.2064-1.2079, 1.2141, 1.2186-1.2205, 1.2245-1.2260. As soon as the price passes 20 pips in the right direction, you should set a Stop Loss to breakeven. On Wednesday, there will be nothing interesting in the UK, but there will be important GDP and ADP reports in America, and Federal Reserve Chairman Jerome Powell will also speak in the evening, which will naturally attract the market's attention.
Basic rules of the trading system:
1) The strength of the signal is determined by the time it took the signal to form (a rebound or a breakout of the level). The quicker it is formed, the stronger the signal is.
2) If two or more positions were opened near a certain level based on a false signal (which did not trigger a Take Profit or test the nearest target level), then all subsequent signals at this level should be ignored.
3) When trading flat, a pair can form multiple false signals or not form them at all. In any case, it is better to stop trading at the first sign of a flat movement.
4) Trades should be opened in the period between the start of the European session and the middle of the US trading hours when all positions must be closed manually.
5) You can trade using signals from the MACD indicator on the 30-minute time frame only amid strong volatility and a clear trend that should be confirmed by a trendline or a trend channel.
6) If two levels are located too close to each other (from 5 to 15 pips), they should be considered support and resistance levels.
On the chart:
Support and Resistance levels are the levels that serve as targets when buying or selling the pair. You can place Take Profit near these levels.
Red lines are channels or trend lines that display the current trend and show in which direction it is better to trade now.
The MACD indicator (14, 22, and 3) consists of a histogram and a signal line. When they cross, this is a signal to enter the market. It is recommended to use this indicator in combination with trend patterns (channels and trendlines).
Important announcements and economic reports that can be found on the economic calendar can seriously influence the trajectory of a currency pair. Therefore, at the time of their release, we recommend trading as carefully as possible or exiting the market in order to avoid sharp price fluctuations.
Beginners on Forex should remember that not every single trade has to be profitable. The development of a clear strategy and money management is the key to success in trading over a long period of time.