 English
  Русский
 Bahasa Indonesia
 Bahasa Malay
 ไทย
ไทย Español
 Deutsch
 Български
 Français
 Tiếng Việt
 中文
中文 বাংলা
বাংলা हिन्दी
 Čeština
 Українська
 Română

Analyzing trades on Wednesday:
EUR/USD on 30M chart
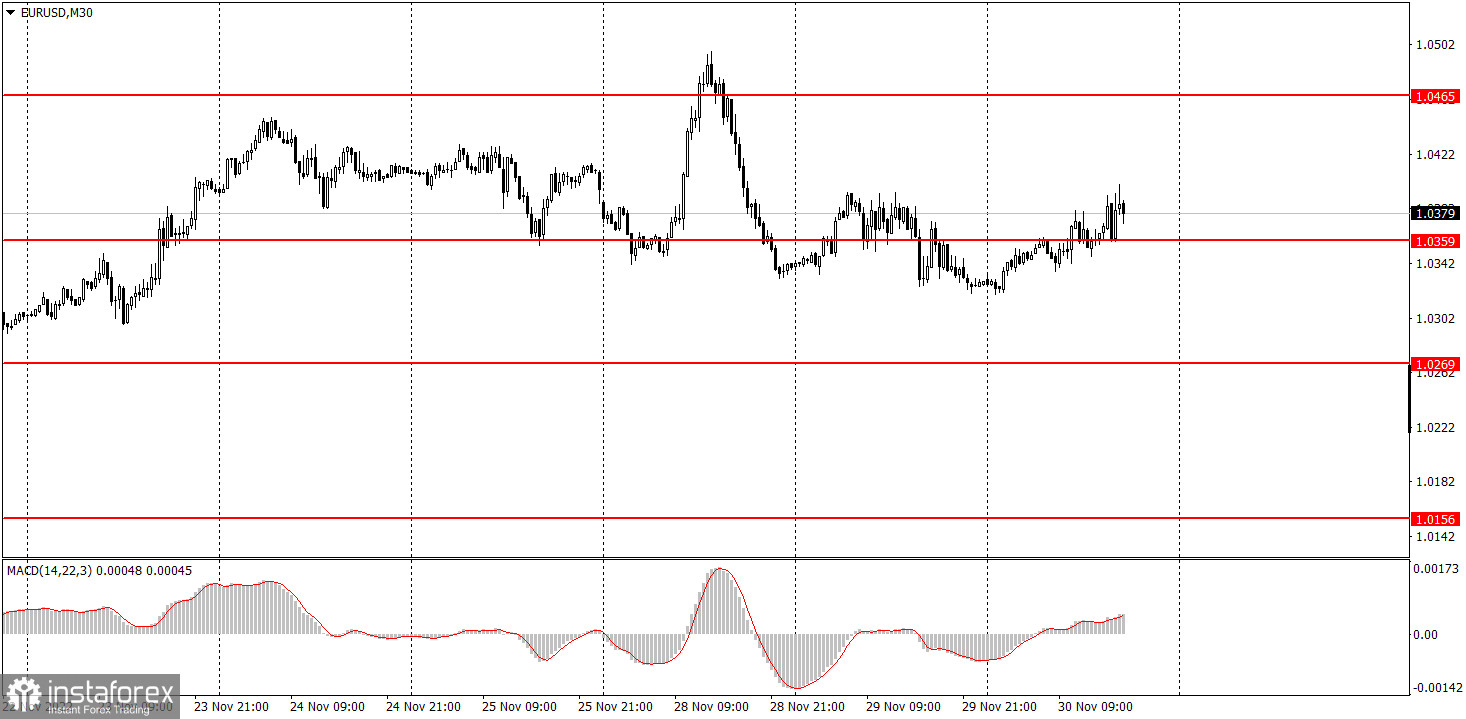
The EUR/USD trade was sluggish and boring on Wednesday, which had nothing to do with the macroeconomic background that traders could use during the day. The volatility of the day was about 80 points, which is not too low, but traders had the right to expect a stronger movement. Take note that at least three relatively important reports were published. Moreover, the word "relatively" hardly applies to the EU inflation report. Since the inflation rate declined by 0.6%, one could expect the euro to fall, just like the US dollar did when the inflation rate in the US started to go down. However, the euro was inclined to rise during the day, which makes no sense at all. There were two important reports in America and they turned out to be "opposite" to each other. While the GDP went up compared to the last report, the ADP report was much weaker than expected. But in this case, too, the euro continued to rise for some reason and not vice versa. If we look at the technical picture of the 30-minute chart as a whole, we can clearly see that there is no trend right now.
EUR/USD on M5 chart
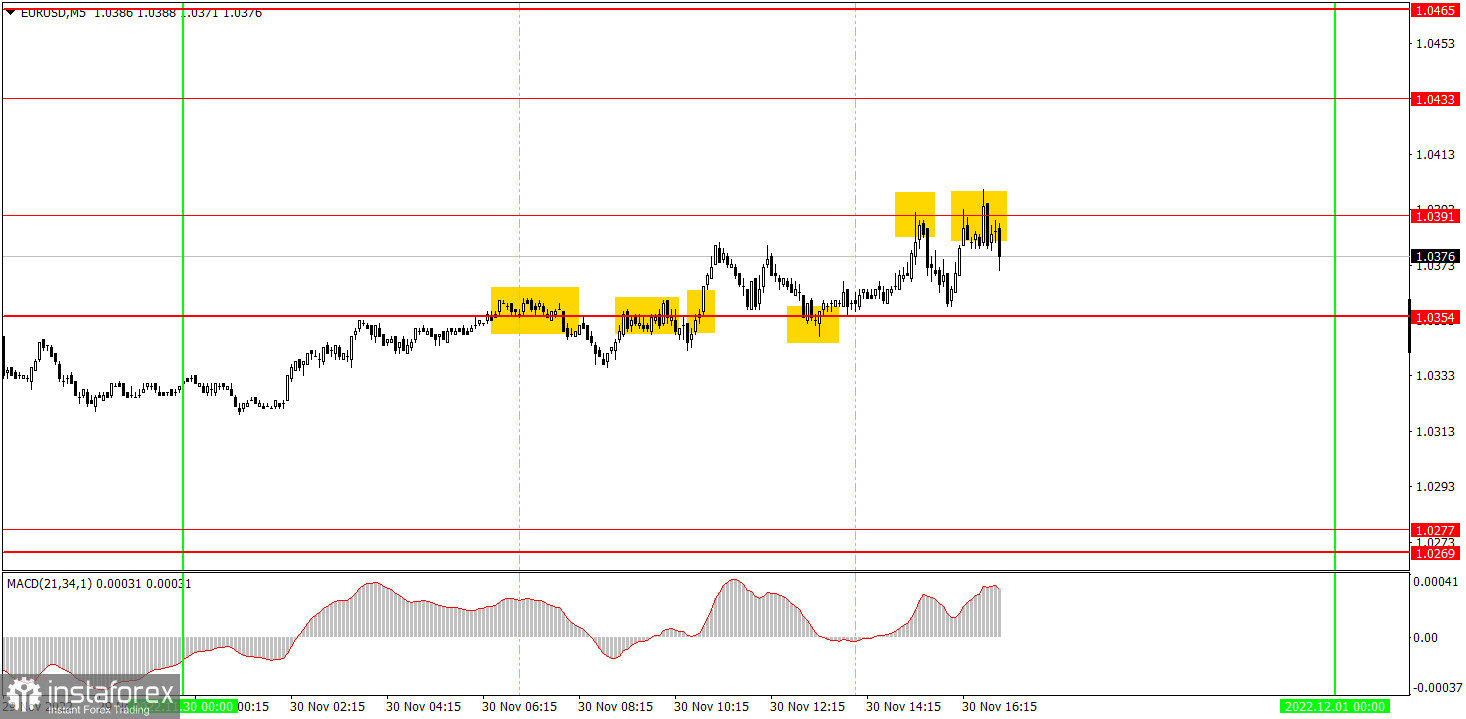
There were a lot of trading signals on the 5-minute chart, and the price was between 1.0354 and 1.0391 for most of the day. In other words, it was in a flat. Therefore, it is not surprising that some signals turned out to be false. The first signals around 1.0354 appeared first, there were four of them. The first two were definitely false, and the price failed to move down 15 pips in the first case, while it did in the second one. Therefore, the short position closed with a small loss, while the long position closed with no profit using Stop Loss. All subsequent signals near 1.0354 should have been ignored. Two sell signals near 1.0391 did not bring much profit either. In the first case, the pair failed to reach the target level by just a few points. It reached the level in the second one, so it was possible to earn 10-15 points, which was enough to cover losses of the first trade. As a result, it was possible to finish the day in positive or negative.
Trading tips on Thursday:
The uptrend has been canceled on the 30-minute time frame, but it may resurface. The pair is gravitating towards growth, but there is no ascending trend line anymore. We witnessed both equally strong growth and decline on Monday. Then we saw a total flat on Tuesday and Wednesday. In my opinion, the technical picture is very confusing right now. On the 5-minute chart on Thursday, it is recommended to trade at the levels of 1.0156, 1.0221, 1.0269-1.0277, 1.0354, 1.0391, 1.0433, 1.0465-1.0483, 1.0535. As soon as the price passes 15 pips in the right direction, you should set a Stop Loss to breakeven. There will be quite a few interesting reports on Thursday: EU unemployment, US income and spending and ISM business activity indices in the US. However, if you think about it, there were quite good reports on Wednesday and we all saw how the market reacted.
Basic rules of the trading system:
1) The strength of the signal is determined by the time it took the signal to form (a rebound or a breakout of the level). The quicker it is formed, the stronger the signal is.
2) If two or more positions were opened near a certain level based on a false signal (which did not trigger a Take Profit or test the nearest target level), then all subsequent signals at this level should be ignored.
3) When trading flat, a pair can form multiple false signals or not form them at all. In any case, it is better to stop trading at the first sign of a flat movement.
4) Trades should be opened in the period between the start of the European session and the middle of the US trading hours when all positions must be closed manually.
5) You can trade using signals from the MACD indicator on the 30-minute time frame only amid strong volatility and a clear trend that should be confirmed by a trendline or a trend channel.
6) If two levels are located too close to each other (from 5 to 15 pips), they should be considered support and resistance levels.
On the chart:
Support and Resistance levels are the levels that serve as targets when buying or selling the pair. You can place Take Profit near these levels.
Red lines are channels or trend lines that display the current trend and show in which direction it is better to trade now.
The MACD indicator (14, 22, and 3) consists of a histogram and a signal line. When they cross, this is a signal to enter the market. It is recommended to use this indicator in combination with trend patterns (channels and trendlines).
Important announcements and economic reports that can be found on the economic calendar can seriously influence the trajectory of a currency pair. Therefore, at the time of their release, we recommend trading as carefully as possible or exiting the market in order to avoid sharp price fluctuations.
Beginners on Forex should remember that not every single trade has to be profitable. The development of a clear strategy and money management is the key to success in trading over a long period of time.