 English
  Русский
 Bahasa Indonesia
 Bahasa Malay
 ไทย
ไทย Español
 Deutsch
 Български
 Français
 Tiếng Việt
 中文
中文 বাংলা
বাংলা हिन्दी
 Čeština
 Українська
 Română

trend analysis:
GBP/USD is likely to move up in December, starting from the closing of the November monthly candle at 1.2056 to the 50.0% retracement level at 1.2286 (red dotted line). Upon reaching it, the quote will continue rising to the 61.8% retracement level at 1.2747 (red dotted line), then roll back downwards.
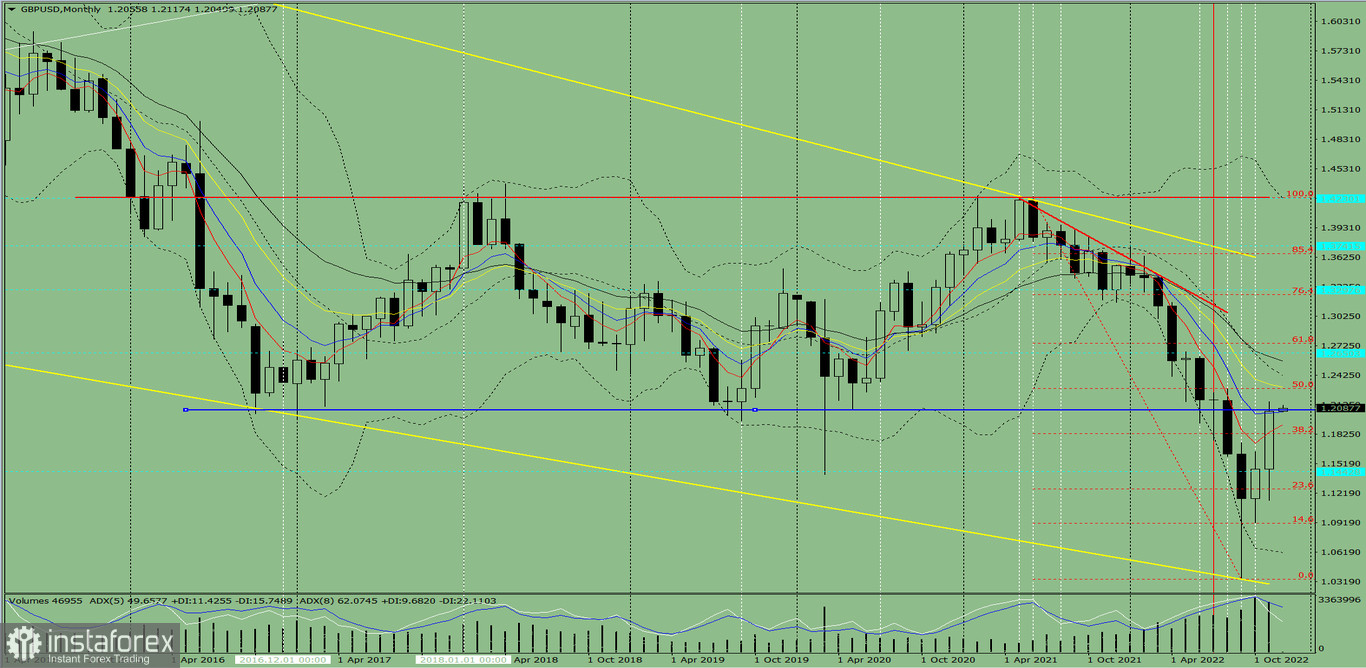
Fig. 1 (monthly chart)
comprehensive analysis:
Indicator analysis - uptrend
Fibonacci levels - uptrend
Volumes - uptrend
Candlestick analysis - uptrend
Trend analysis - uptrend
Bollinger bands - uptrend
All this points to an upward movement in GBP/USD.
Conclusion: The pair will have a bullish trend with no first lower shadow on the monthly white candle (the first week of the month is white) and no second upper shadow (the last week is white).
Throughout the month, pound will climb from 1.2056 (closing of the November monthly candle) to the 50.0% retracement level at 1.2286 (red dotted line), go further to the 61.8% retracement level at 1.2747 (red dotted line), then turn downwards.
Alternatively, it could rise from 1.2056 (closing of the November monthly candle) to the 50.0% retracement level at 1.2286 (red dotted line), then bounce down to the support level of 1.2071 (dark blue line). Upward movement may resume from this level.