 English
  Русский
 Bahasa Indonesia
 Bahasa Malay
 ไทย
ไทย Español
 Deutsch
 Български
 Français
 Tiếng Việt
 中文
中文 বাংলা
বাংলা हिन्दी
 Čeština
 Українська
 Română

The 105.00 support level on the DXY chart is still standing and resisting a breakout, and economists say the 105.00 level should keep the dollar index from falling deeper.
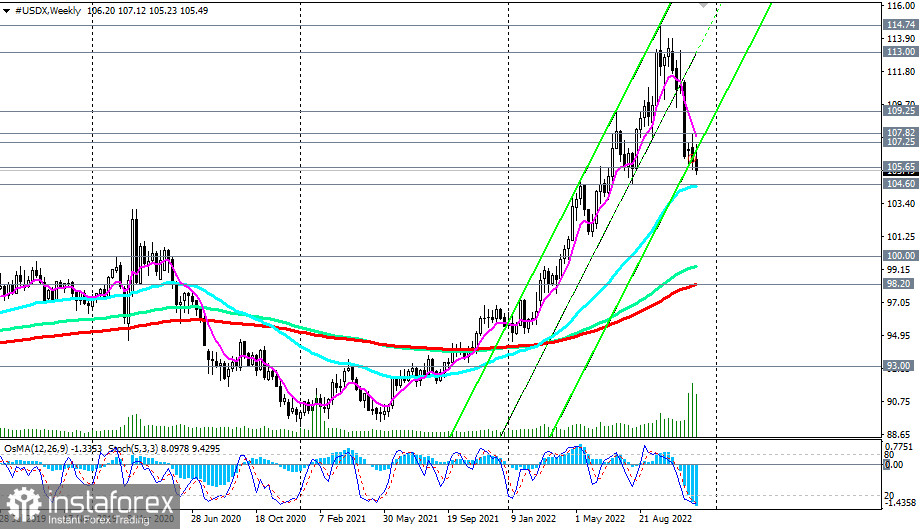
From a technical point of view, the DXY index (reflected as CFD #USDX in the MT4 trading terminal) found support at a strong and important level of 105.65 (200-period moving average on the CFD #USDX daily chart).
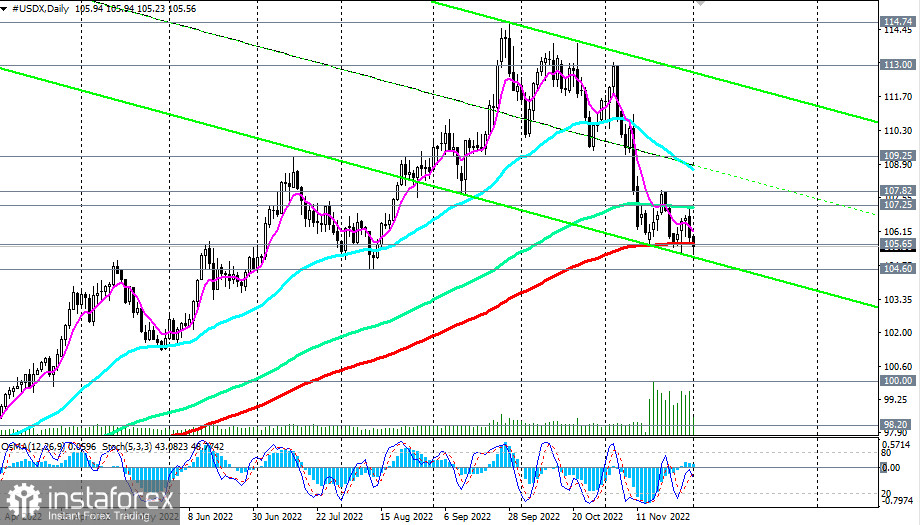
Growth into the zone above the resistance levels 107.25 (144 EMA on the daily chart), 107.82 (local resistance level) will signal the resumption of the upward dynamics of DXY.
Alternatively, a breakdown of the 104.60 support level (50 EMA on the weekly chart) can significantly worsen the prospects for the dollar and its DXY index, moving them into the bear market zone. The breakdown of the 98.20 key support level (200 EMA on the weekly chart) will finally break the bullish trend of DXY.
Support levels: 105.65, 105.00, 104.60
Resistance levels: 107.25, 107.82, 108.00, 109.00, 109.25, 110.00, 111.00, 113.00
Trading Tips
Sell Stop 104.90. Stop Loss 106.10. Take-Profit 104.60, 104.00, 103.00, 102.00, 100.00
Buy Stop 106.10. Stop-Loss 104.90. Take-Profit 107.00, 107.25, 107.82, 108.00, 109.00, 109.25, 110.00, 111.00, 113.00