 English
  Русский
 Bahasa Indonesia
 Bahasa Malay
 ไทย
ไทย Español
 Deutsch
 Български
 Français
 Tiếng Việt
 中文
中文 বাংলা
বাংলা हिन्दी
 Čeština
 Українська
 Română

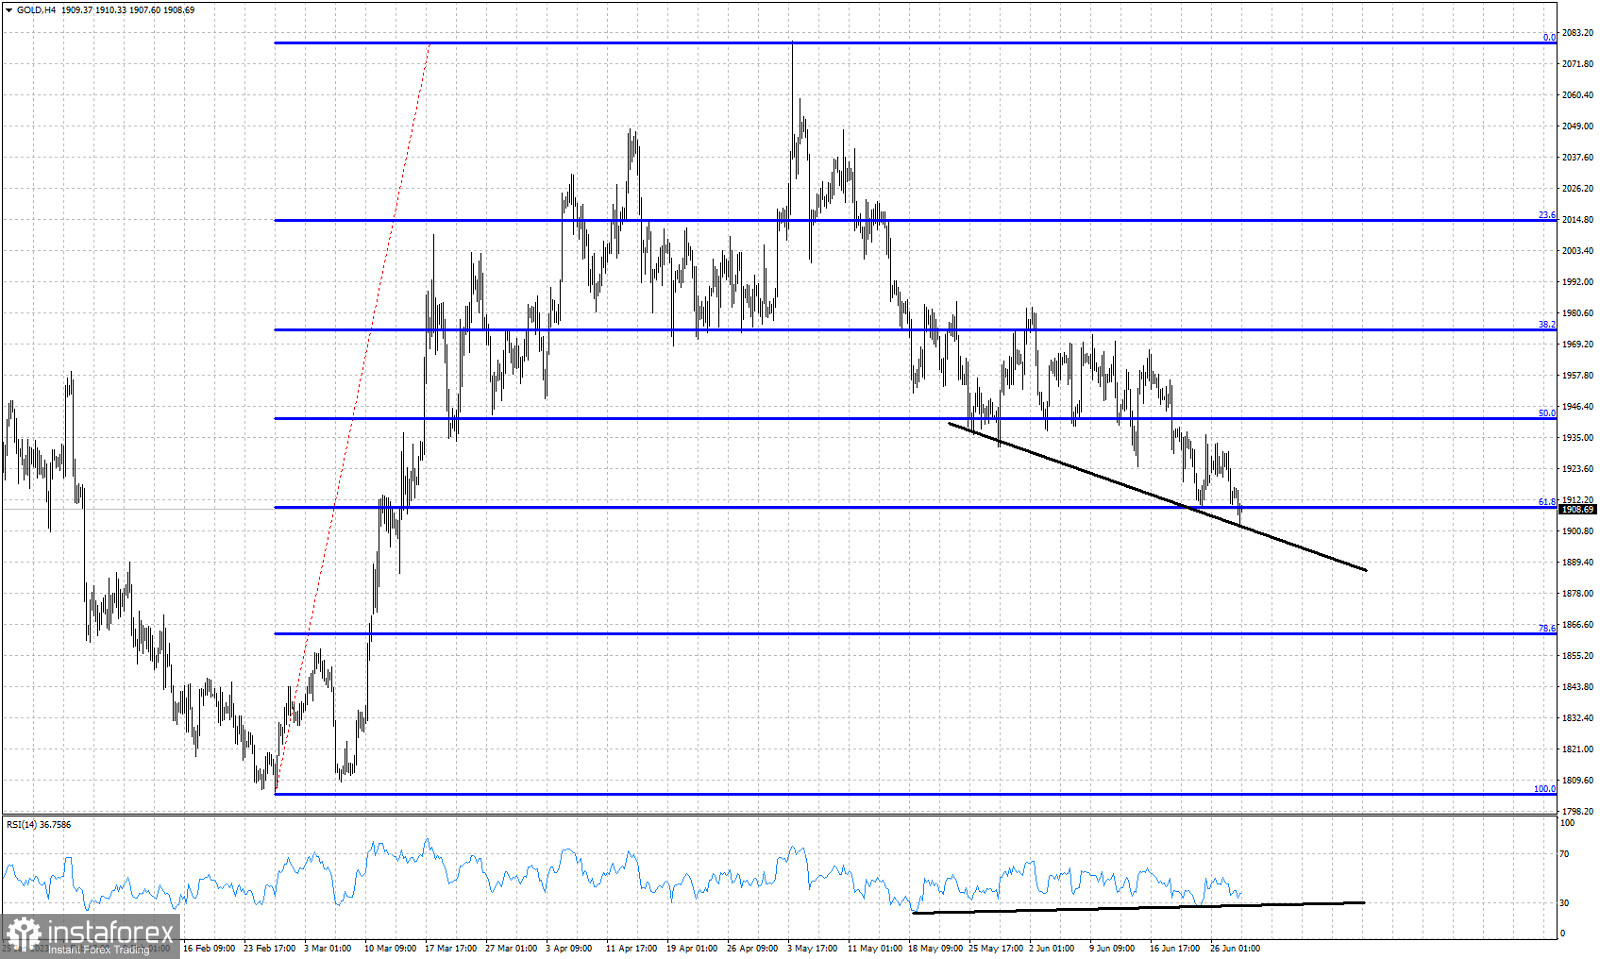
Black lines- Bullish RSI divergence
Blue lines- Fibonacci retracement levels
Gold price made new lower lows today around $1,902. Gold remains in a bearish trend making lower lows and lower highs. The RSI is providing bullish divergence signs. The RSI is making higher lows. The bullish divergence is only a warning for bears. Not a reversal sign. Gold is trading around the 61.8% Fibonacci retracement of the entire upward movement. This retracement level is a highly probable reversal level. Despite breaking to new lows, Gold price is not accelerating the decline. Traders need to be cautious.