 English
  Русский
 Bahasa Indonesia
 Bahasa Malay
 ไทย
ไทย Español
 Deutsch
 Български
 Français
 Tiếng Việt
 中文
中文 বাংলা
বাংলা हिन्दी
 Čeština
 Українська
 Română

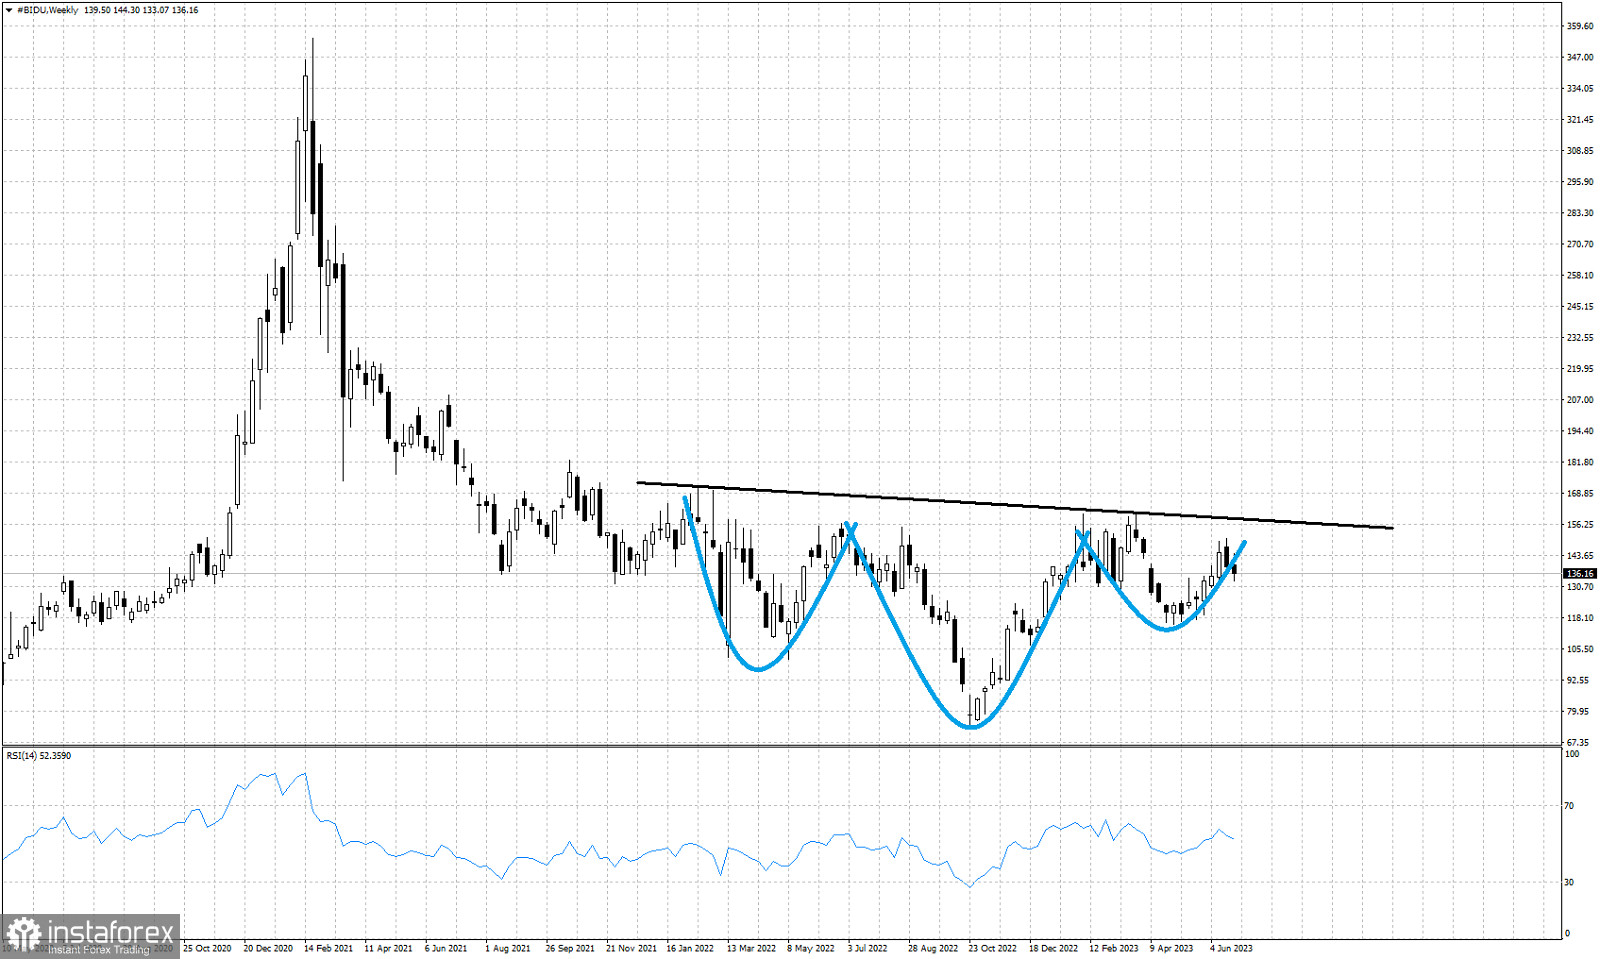
Black line- neckline resistance
Blue lines- Head and Shoulders pattern
The Bidu stock price is trading around $136. Price has mostly been moving sideways over the last 2 years. Today we focus on the inverted head and shoulders pattern it has formed in the weekly chart. The neckline resistance is found at $158-$159 and a weekly close above this level will activate this bullish pattern. If the pattern is activated then we will have $240-$250 as a target. Support is at the right hand shoulder low of $115. A break below this level cancels this scenario.