 English
  Русский
 Bahasa Indonesia
 Bahasa Malay
 ไทย
ไทย Español
 Deutsch
 Български
 Français
 Tiếng Việt
 中文
中文 বাংলা
বাংলা हिन्दी
 Čeština
 Українська
 Română

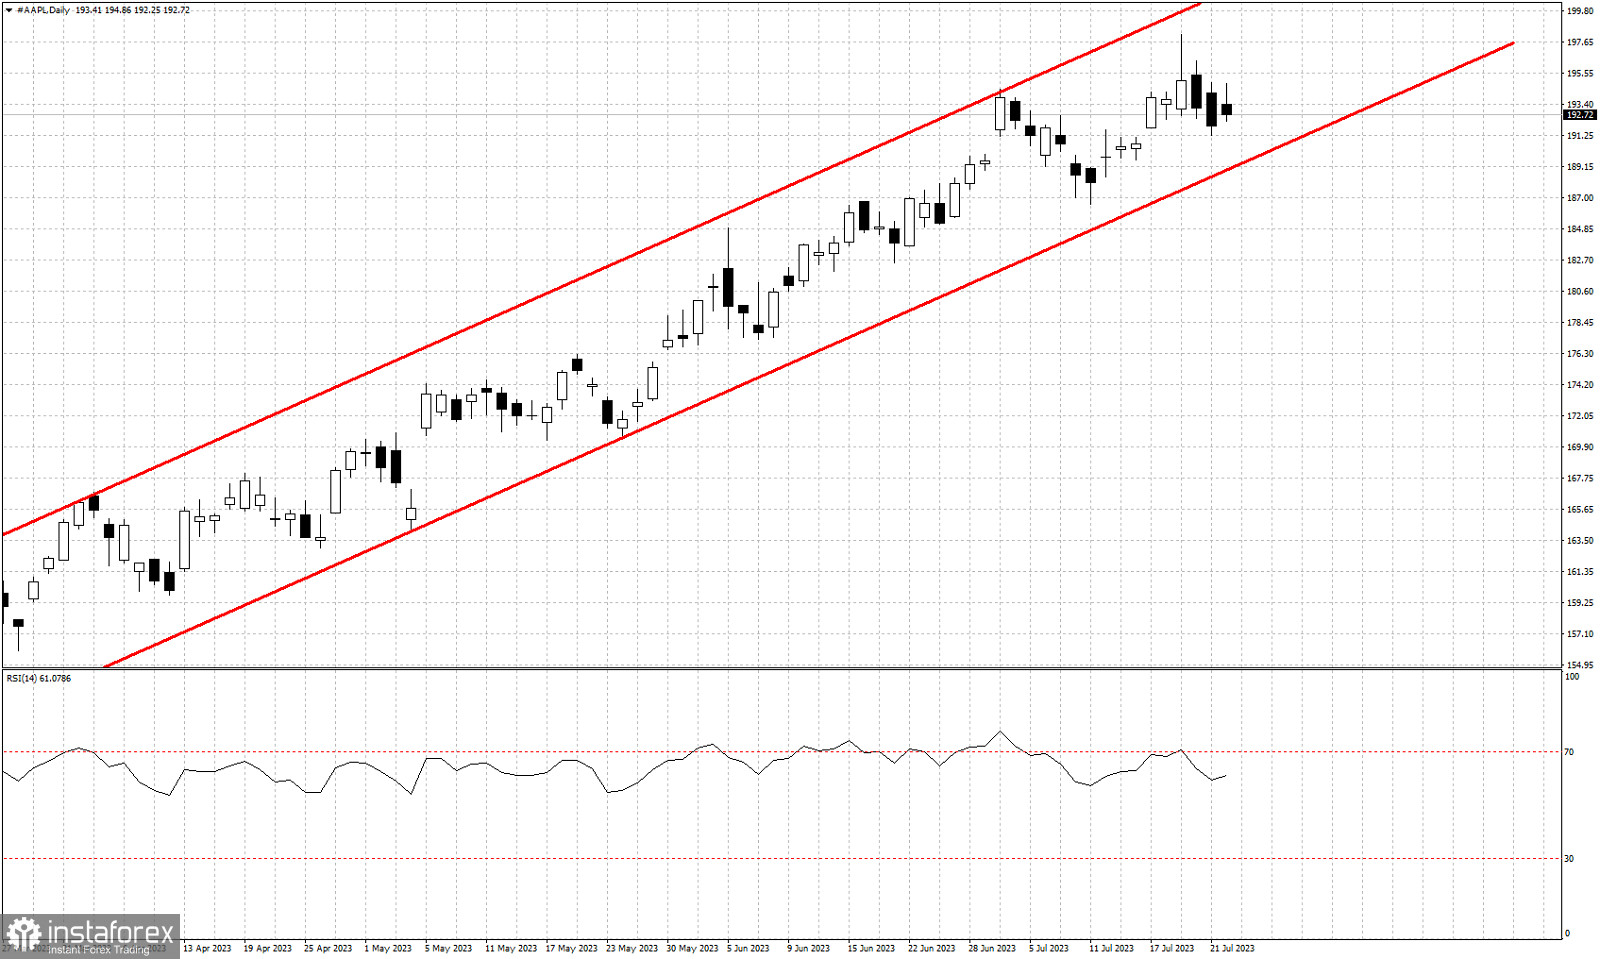
Red lines- bullish channel
AAPL stock price remains in a bullish trend making higher highs and higher lows. Price is trading around $192-$193 inside the red upward sloping channel. As long as this is the case we consider trend is bullish. Short-term support is found at the lower channel boundary at $189. A break below $189 would be a bearish sign and the signal for the start of a pull back. The recent higher high in price was not followed by a higher high in the RSI. This was our first bearish divergence. This is not a reversal signal but only a warning. If price breaks below the channel, then we focus on the $187 area where we find the latest higher low. Bulls need to defend this support area.