 English
  Русский
 Bahasa Indonesia
 Bahasa Malay
 ไทย
ไทย Español
 Deutsch
 Български
 Français
 Tiếng Việt
 中文
中文 বাংলা
বাংলা हिन्दी
 Čeština
 Українська
 Română

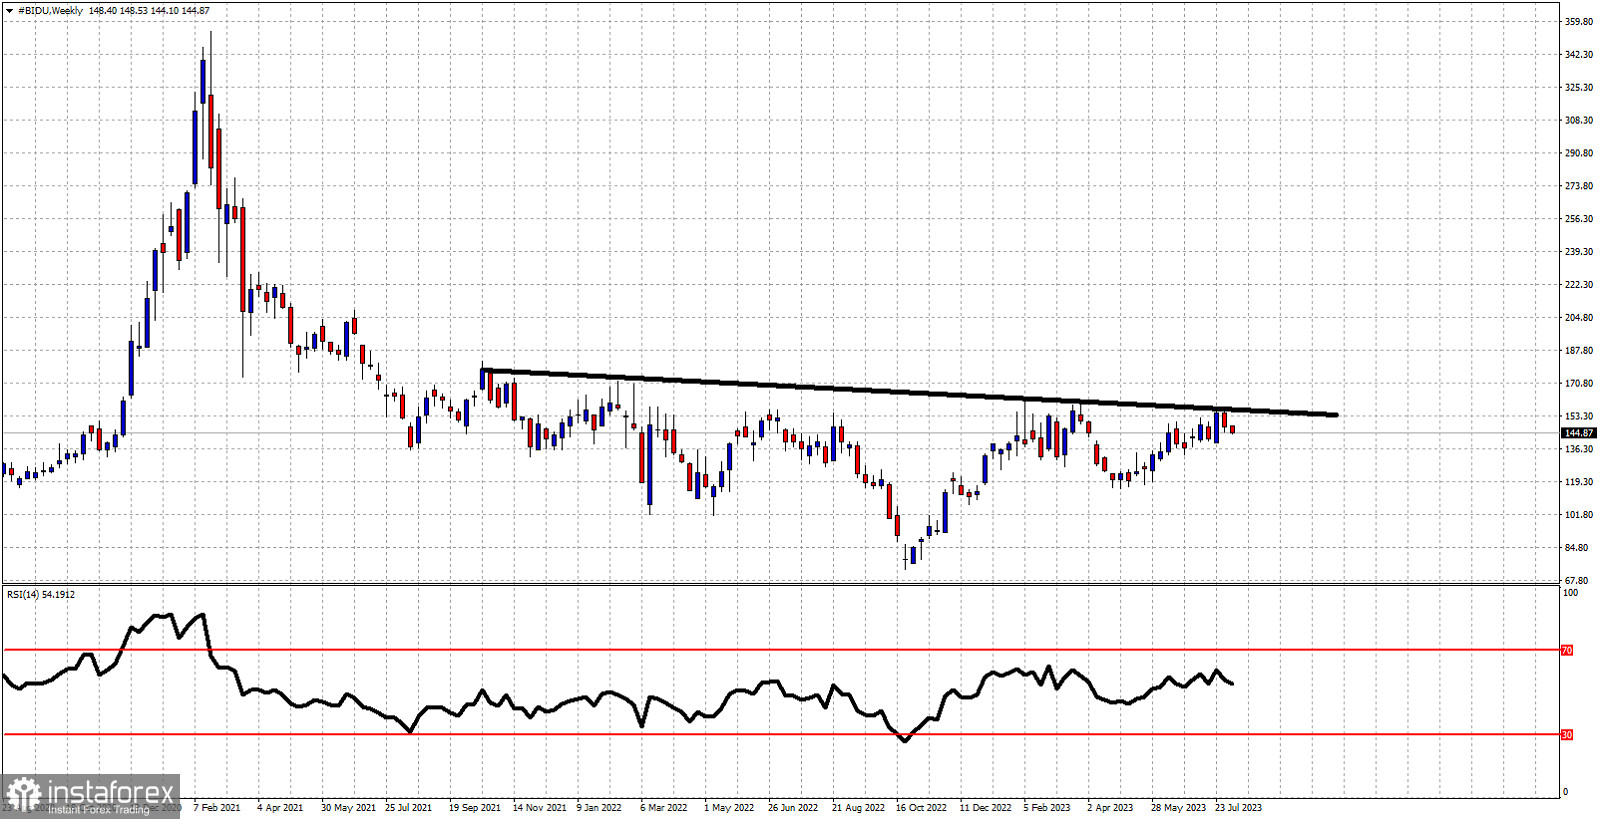
Black line - neckline resistance trend line
BIDU stock price has started trading this week under pressure around $144-$145 after last week's rejection at $156.75. As we mentioned in previous posts, BIDU stock price has formed an inverted head and shoulders pattern with excellent upside potential, IF price breaks above the black resistance trend line. The black neckline resistance has been confirmed several times over the last two years. A weekly close above $157 would provide a bullish signal that will give us $245 as target.