 English
  Русский
 Bahasa Indonesia
 Bahasa Malay
 ไทย
ไทย Español
 Deutsch
 Български
 Français
 Tiếng Việt
 中文
中文 বাংলা
বাংলা हिन्दी
 Čeština
 Українська
 Română

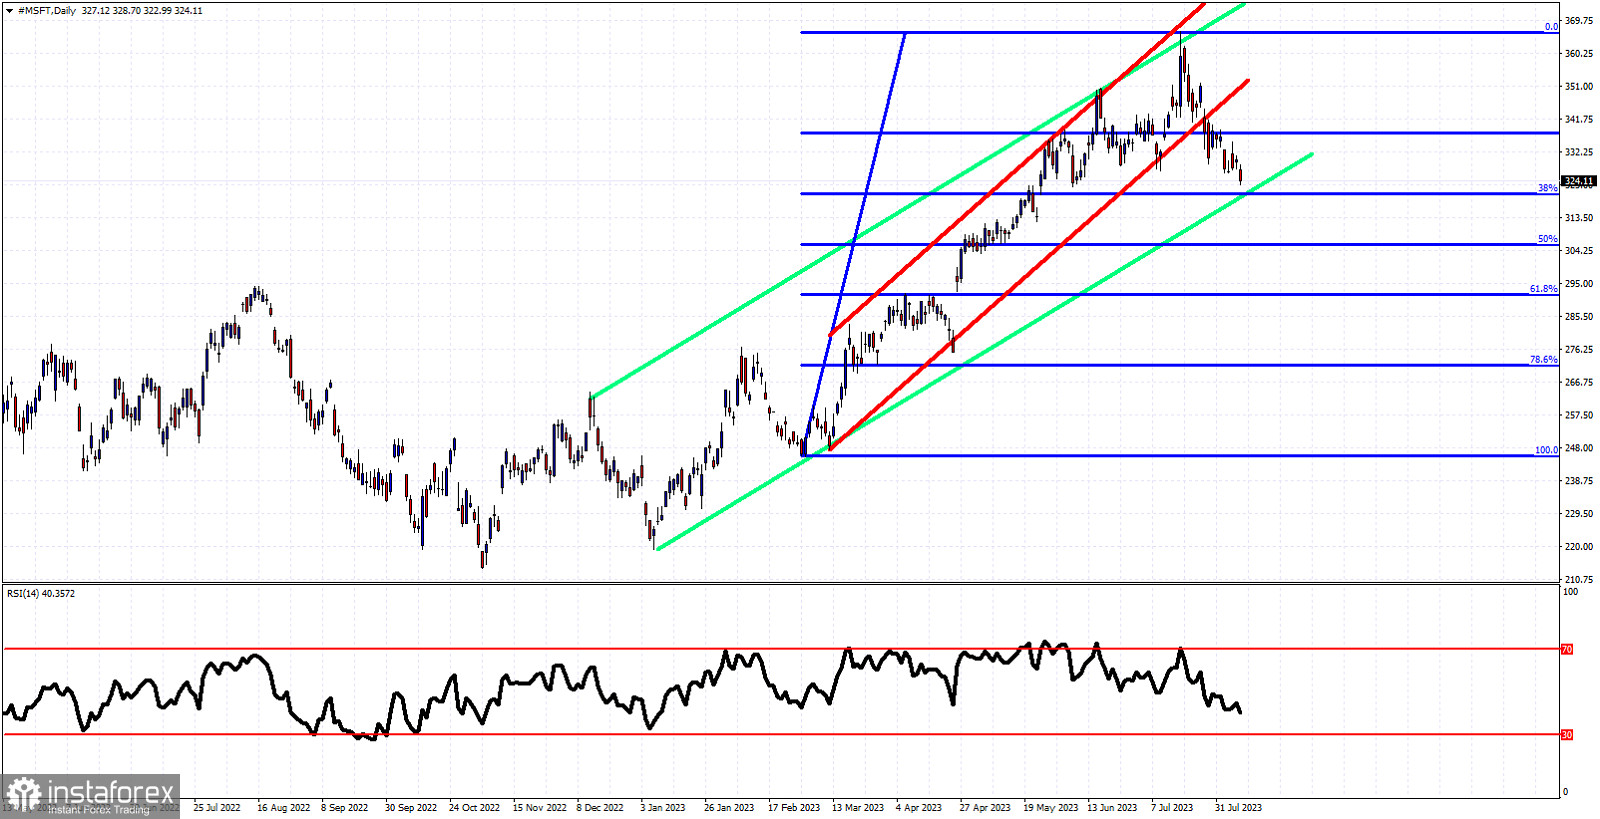
Red lines- bullish channel (broken)
Green lines- bullish channel
Blue lines- Fibonacci retracement levels
MSFT stock price is in a short-term bearish trend. After the major high around $366, MSFT stock price started a short-term bearish trend that pushed price out and below the red channel. The move from the $247 low is most probably over and price is now making a correction for this upward wave. MSFT stock price is approaching important Fibonacci support. The 38% Fibonacci retracement is found at $320 where we also find the lower channel boundary of the bigger green channel. This is important support that bulls do not want to see broken. MSFT is approaching important support area and possible reversal area.