 English
  Русский
 Bahasa Indonesia
 Bahasa Malay
 ไทย
ไทย Español
 Deutsch
 Български
 Français
 Tiếng Việt
 中文
中文 বাংলা
বাংলা हिन्दी
 Čeština
 Українська
 Română

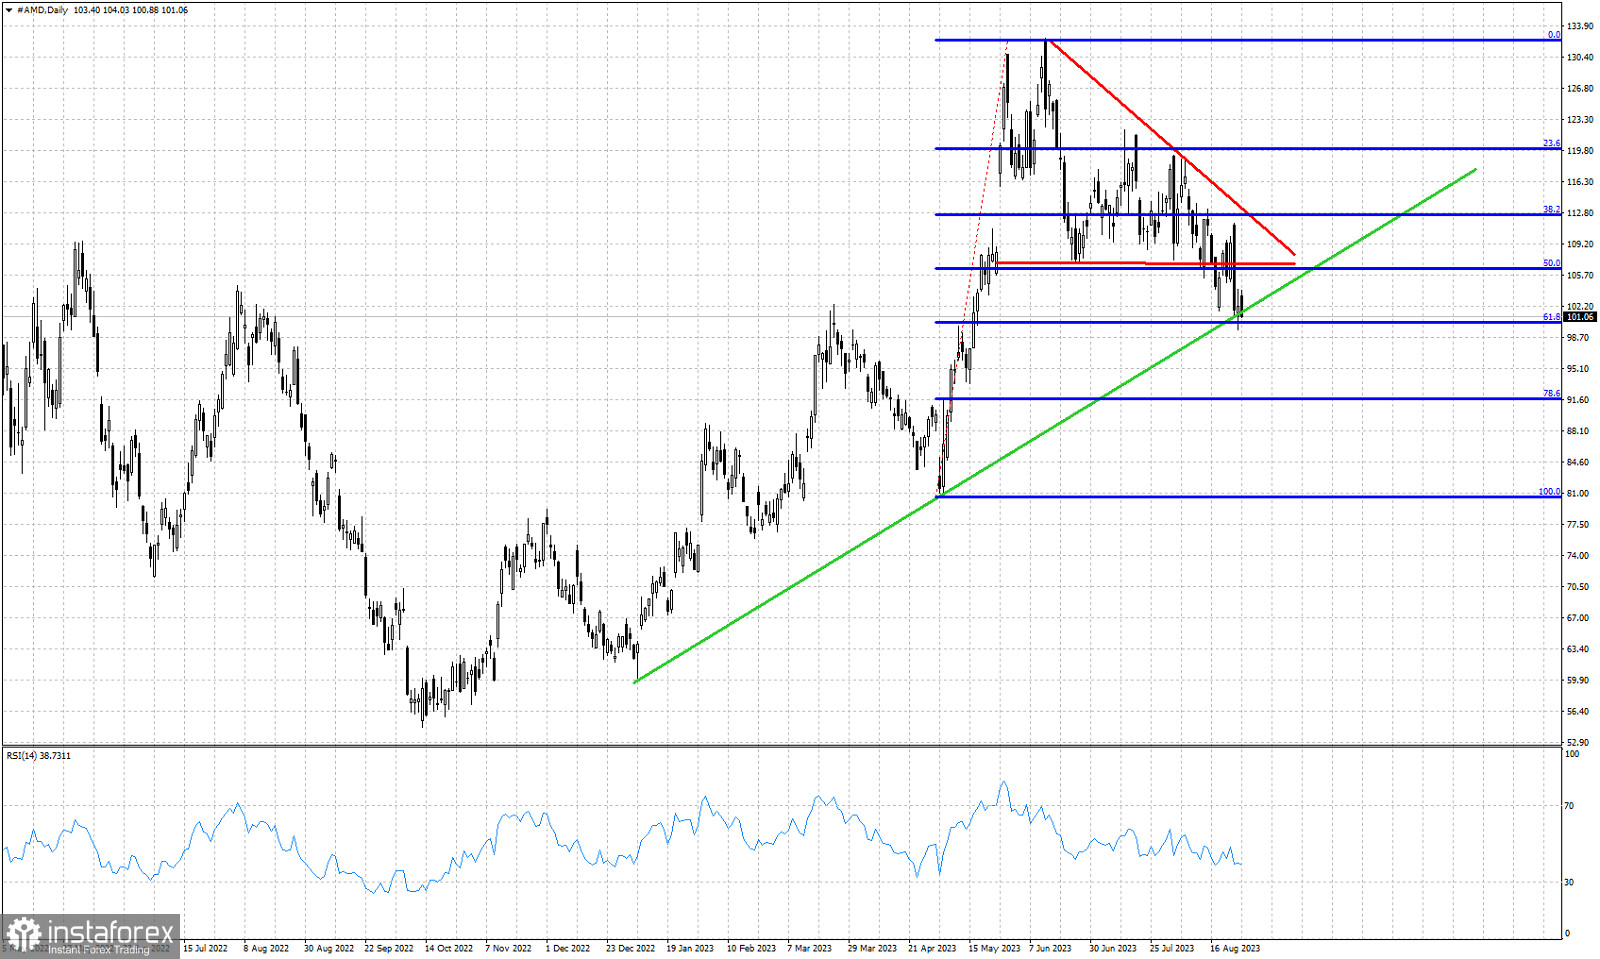
Green line- support trend line
Blue lines- Fibonacci retracement levels
Red lines- triangle pattern
AMD stock price is trading around $102. Short-term trend is bearish. Price has broken the triangle pattern to the downside. Price is making lower lows and lower highs in the near term. Price has reached the 61.8% Fibonacci retracement of the last major upward move. Price is also challenging the green upward sloping support trend line. Around $102 we find important short-term support. Breaking below $102 and staying below this level will lead price towards at least $92-$91 where we find the 78.6% Fibonacci retracement. Previous support at $107 is now resistance. Bulls need first to recapture this level in order to hope for a bigger move higher.