 English
  Русский
 Bahasa Indonesia
 Bahasa Malay
 ไทย
ไทย Español
 Deutsch
 Български
 Français
 Tiếng Việt
 中文
中文 বাংলা
বাংলা हिन्दी
 Čeština
 Українська
 Română

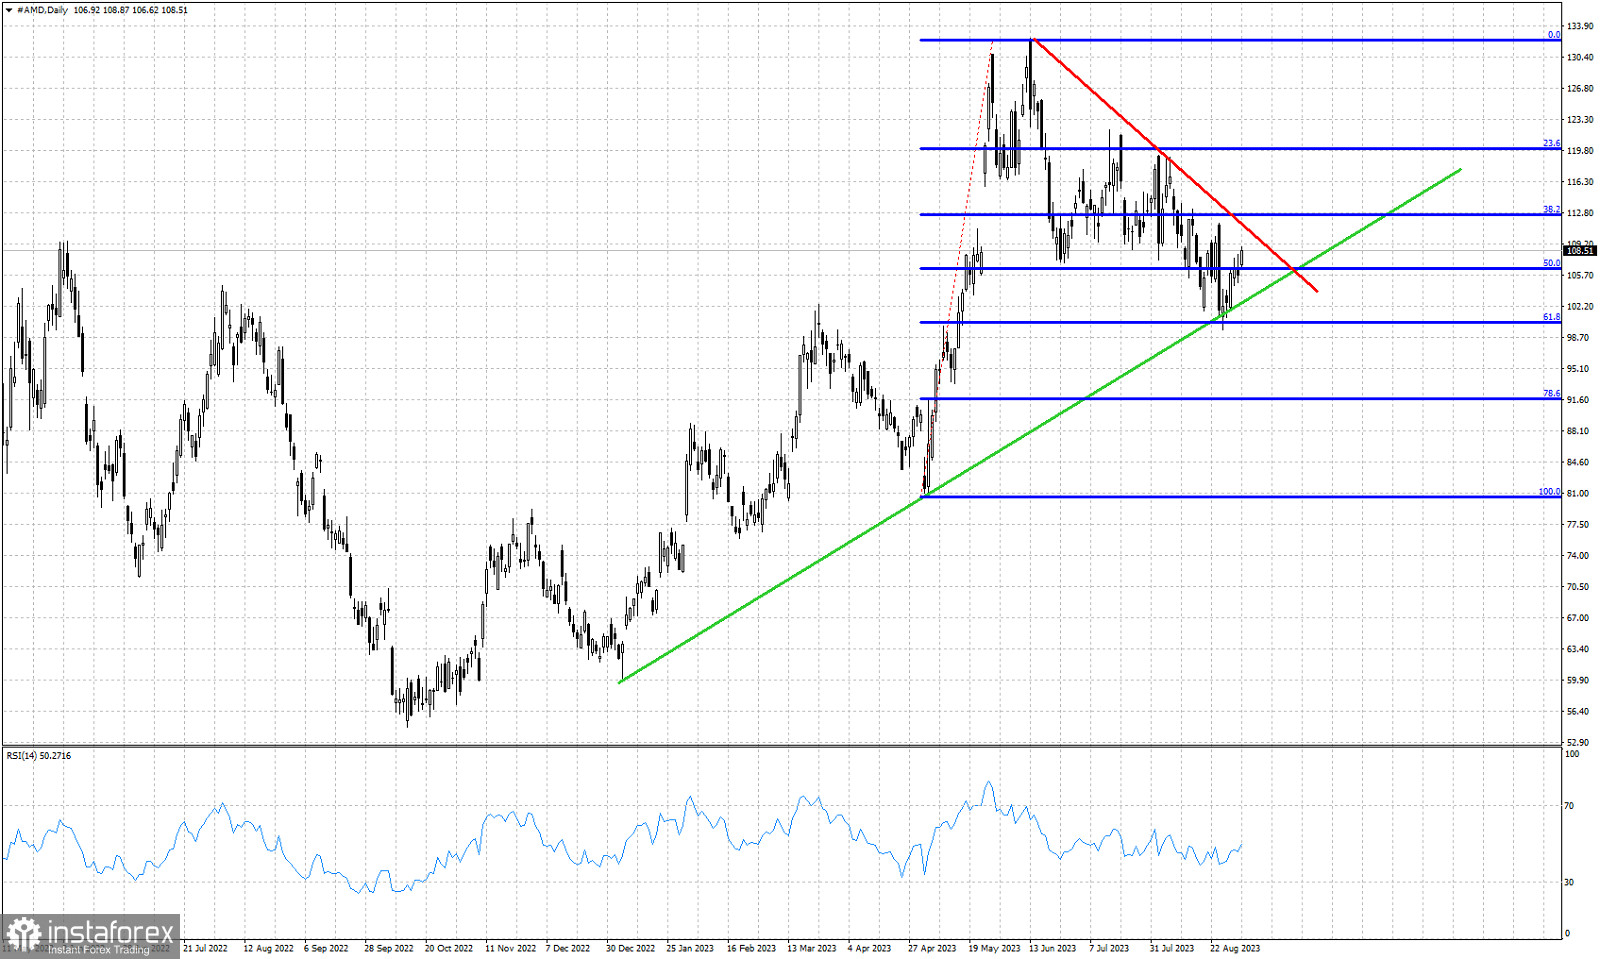
Red line - resistance
Green line- support trend line
Blue lines - Fibonacci retracement levels
AMD stock price is trading around $108.70 after respecting the green upward sloping support trend line. AMD bulls continue to respect the green support trend line. Price has held above the green trend line and the 61.8% Fibonacci retracement level. As long as price holds above the green support trend line and the 61.8% Fibonacci retracement, expectations remain bullish. For bears to reclaim control of the trend we need to see price break below support of $101-$102.