 English
  Русский
 Bahasa Indonesia
 Bahasa Malay
 ไทย
ไทย Español
 Deutsch
 Български
 Français
 Tiếng Việt
 中文
中文 বাংলা
বাংলা हिन्दी
 Čeština
 Українська
 Română

Trend analysis (Fig. 1).
The pound-dollar pair may move downward from the level of 1.2181 (closing of yesterday's daily candle) to test 1.2105, the 23.6% pullback level (yellow dotted line). When testing this level, the price may move upward to 1.2198, the upper fractal (yellow dotted line).
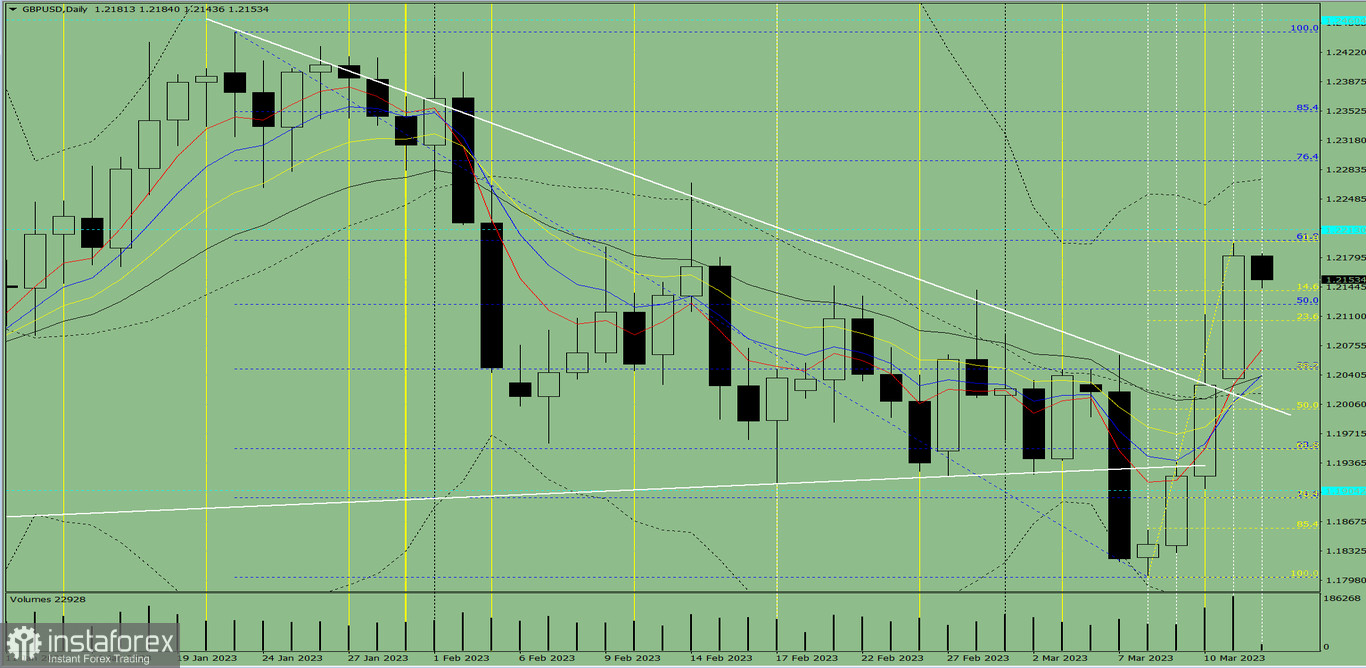
Fig. 1 (daily chart).
Comprehensive analysis:
- Indicator analysis - down;
- Volumes - down;
- Candlestick analysis - down;
- Trend analysis - down;
- Bollinger bands - bottom;
- Weekly chart - down.
General conclusion:
Today, the price may move downward from the level of 1.2181 (closing of yesterday's daily candle) to test 1.2105, the 23.6% pullback level (yellow dotted line). When testing this level, the price may move upward to 1.2198, the upper fractal (yellow dotted line).
Alternatively, the price may move downward from the level of 1.2181 (closing of yesterday's daily candle) to test 1.2070, the 5-day EMA (thin red line). When testing this level, the price may move up.