 English
  Русский
 Bahasa Indonesia
 Bahasa Malay
 ไทย
ไทย Español
 Deutsch
 Български
 Français
 Tiếng Việt
 中文
中文 বাংলা
বাংলা हिन्दी
 Čeština
 Українська
 Română

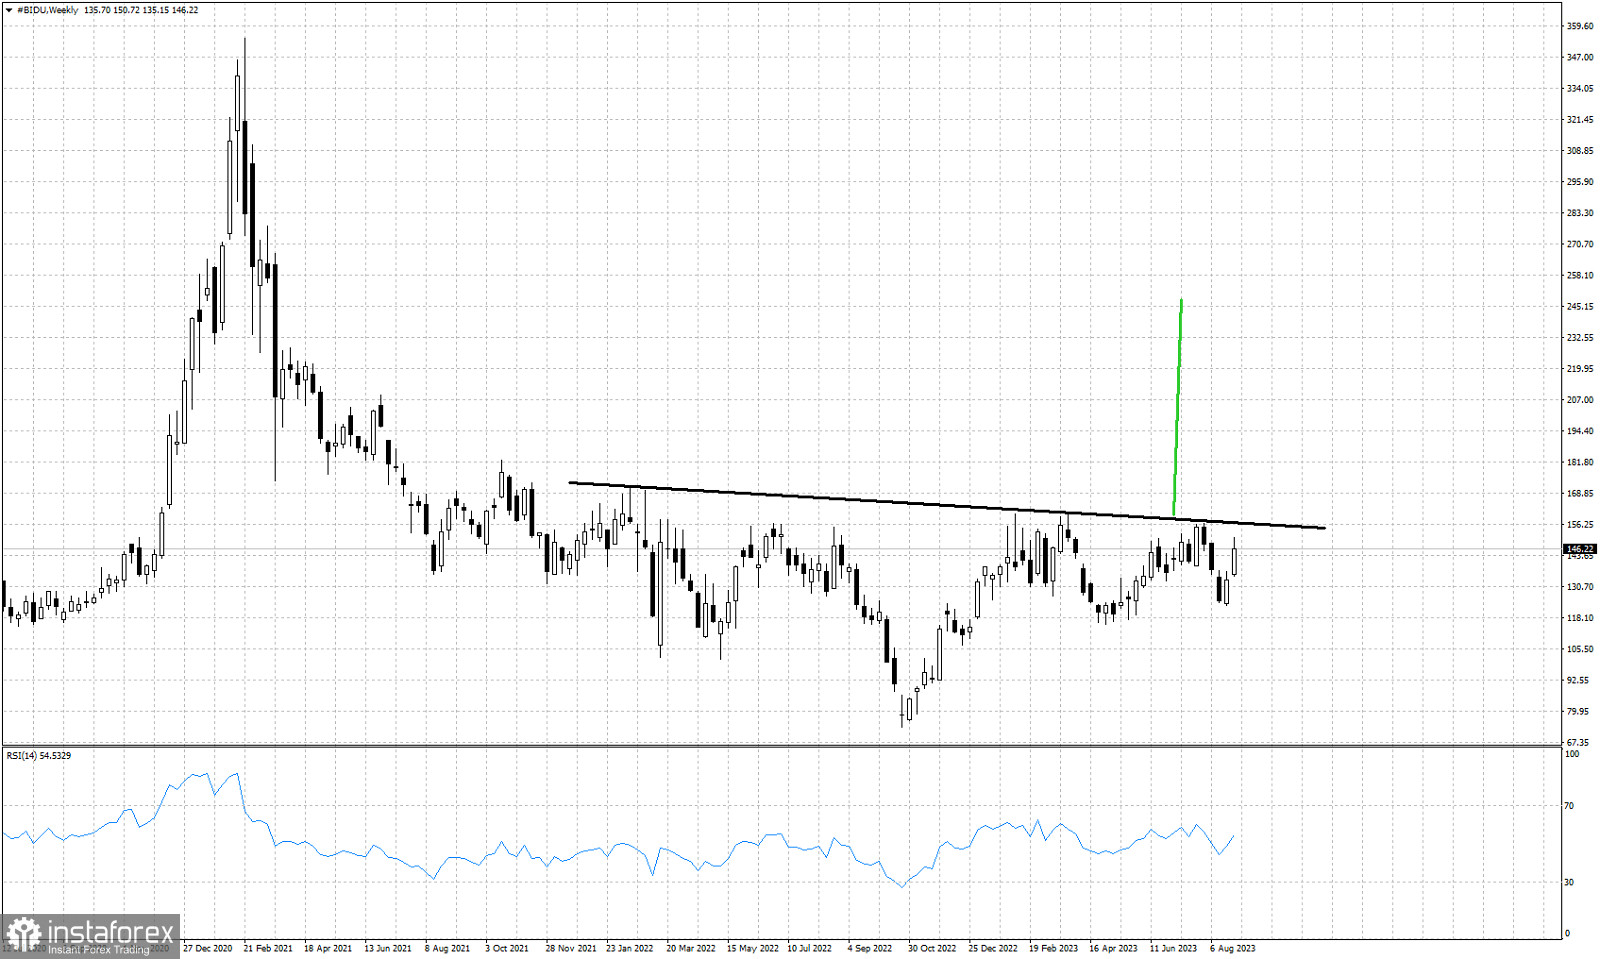
Black line -resistance neckline
green line- potential upside according to inverted head and shoulders pattern
In previous posts we talked about the potential inverted head and shoulders pattern in BIDU stock chart. In the weekly chart we clearly see another attempt by bulls to challenge the black horizontal resistance neckline. Key resistance remains at $156.50. A break above this neckline resistance will be a major bullish signal. Price action over the past 2 years has confirmed the importance of this resistance trend line. So a break above it will be big news for the stock price. An activation of the inverted head and shoulders pattern could mean price could move towards $250.