 English
  Русский
 Bahasa Indonesia
 Bahasa Malay
 ไทย
ไทย Español
 Deutsch
 Български
 Français
 Tiếng Việt
 中文
中文 বাংলা
বাংলা हिन्दी
 Čeština
 Українська
 Română

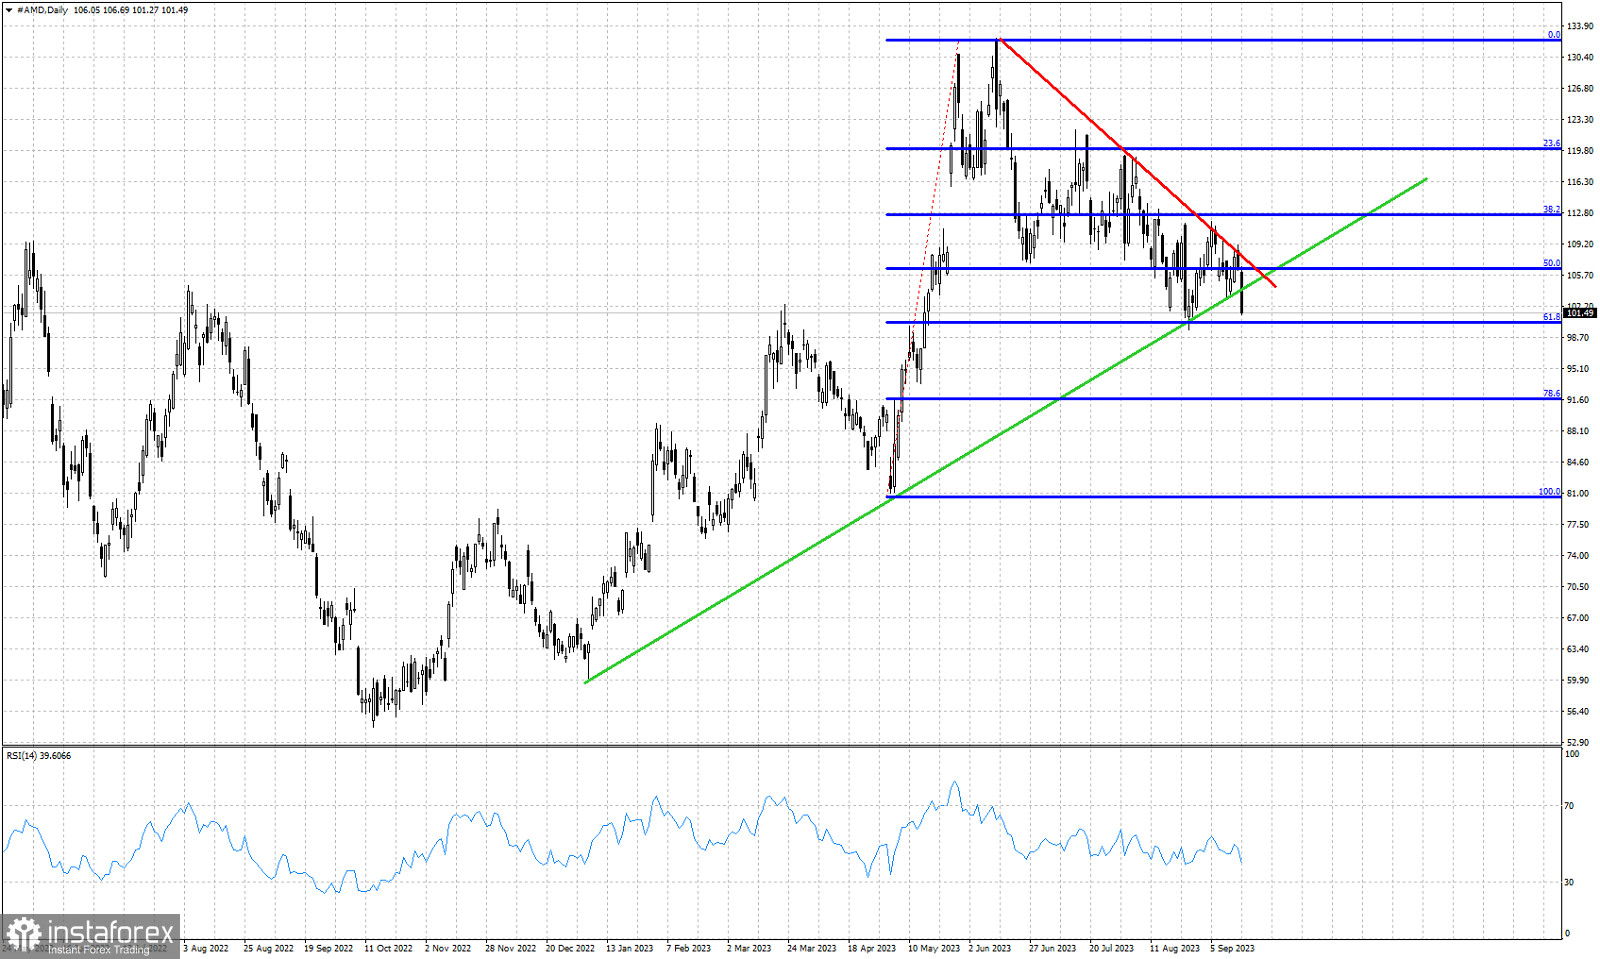
Green line- support trend line
Red line- resistance trend line
Blue lines -Fibonacci retracements
By the end of the previous week, AMD stock price closed around $101.50 breaking below the green upward sloping support trend line. Last week price got rejected at the red downward sloping resistance trend line. Price is now challenging once again the 61.8% Fibonacci retracement. The 61.8% Fibonacci retracement level provides support at $100.20. A break below this level will strengthen the bearish signal from last week. Next downside target will be at $91.50 if support at $100 fails to hold. Bulls need to push price above $107-108 in order to reclaim control of the short-term trend. AMD stock price is vulnerable to the downside as long as price holds below the $108 level.