 English
  Русский
 Bahasa Indonesia
 Bahasa Malay
 ไทย
ไทย Español
 Deutsch
 Български
 Français
 Tiếng Việt
 中文
中文 বাংলা
বাংলা हिन्दी
 Čeština
 Українська
 Română

Trend analysis (Fig. 1).
The euro-dollar pair, for this week, may move downward from the level of 1.0838 (closing of the last weekly candle) to 1.0722, the 50.0% pullback level (blue dotted line). Upon reaching this level, an upward movement is possible with the target of 1.0929, the upper fractal (blue dotted line).
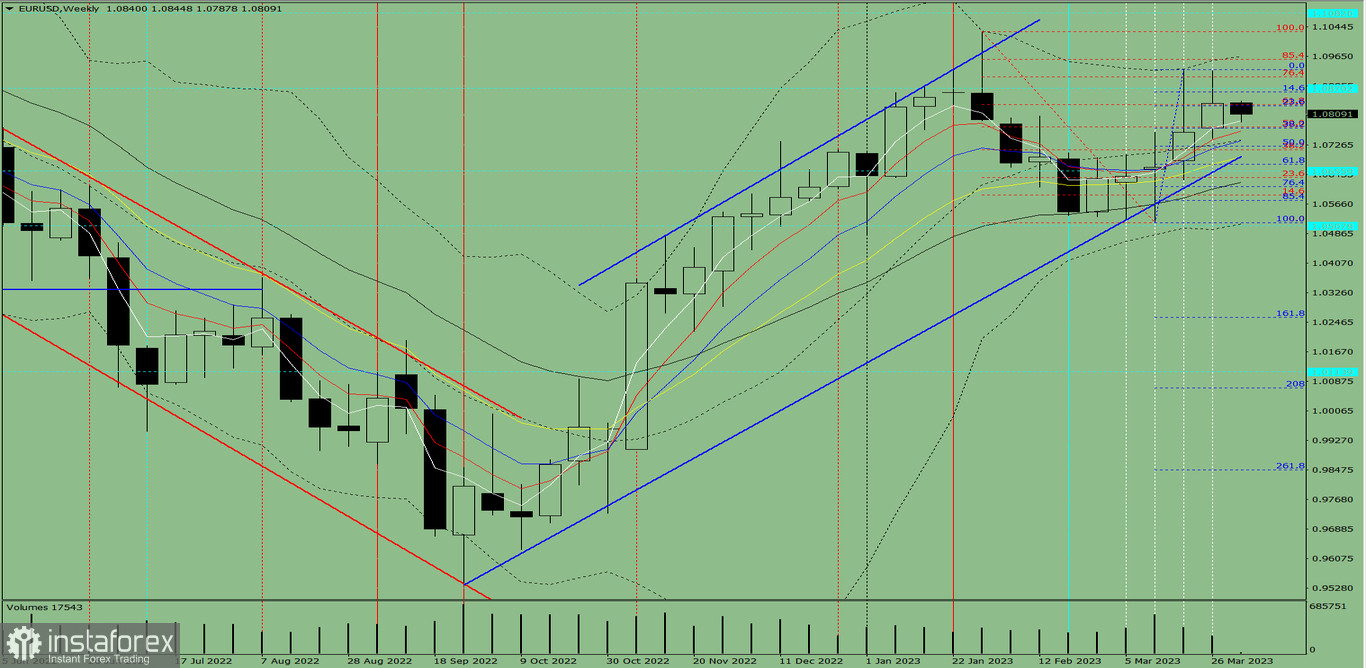
Fig. 1 (weekly chart).
Comprehensive analysis:
- Indicator analysis - down;
- Fibonacci levels - down;
- Volumes - down;
- Candlestick analysis - down;
- Trend analysis - up;
- Bollinger bands - up;
- Monthly chart - down.
All this points to a downward movement in EUR/USD.
Conclusion: The pair will have a bearish trend, with no first upper shadow on the weekly black candle (Monday - down) and no second lower shadow (Friday - up).
This week, the price may move downward from the level of 1.0838 (closing of the last weekly candle) to 1.0722, the 50.0% pullback level (blue dotted line). Upon reaching this level, an upward movement is possible with the target of 1.0929, the upper fractal (blue dotted line).
Alternatively, the price may move downward from the level of 1.0838 (closing of the last weekly candle) to 1.0673, the 61.8% pullback level (blue dotted line). Upon reaching this level, an upward movement is possible with the target of 1.0929, the upper fractal (blue dotted line).