 English
  Русский
 Bahasa Indonesia
 Bahasa Malay
 ไทย
ไทย Español
 Deutsch
 Български
 Français
 Tiếng Việt
 中文
中文 বাংলা
বাংলা हिन्दी
 Čeština
 Українська
 Română

Trend analysis.
This week, the pound-dollar pair may move downward from 1.2328 (closing of the last weekly candle) to 1.2136, the 14.6% pullback level (yellow dotted line). When testing this level, an upward movement is possible with the target of 1.2499, the historical resistance level (blue dotted line).
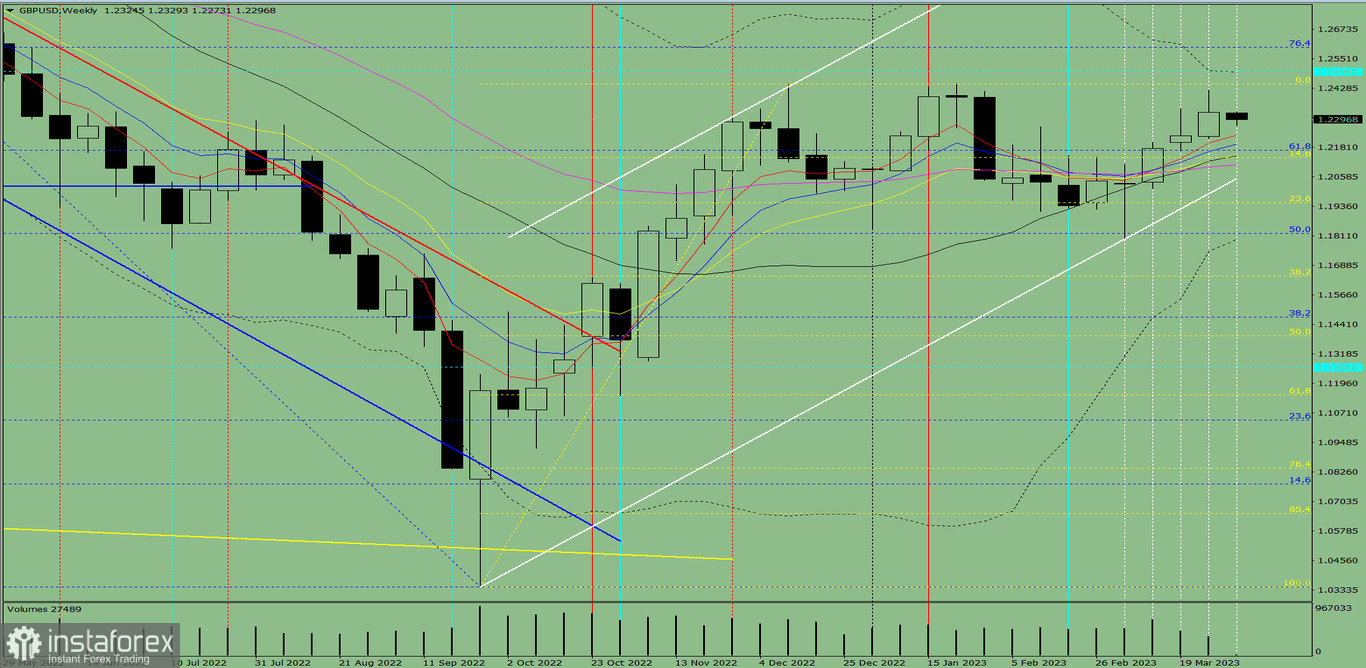
Fig. 1 (weekly chart).
Comprehensive analysis:
- Indicator analysis - down;
- Fibonacci levels - down;
- Volumes - down;
- Candlestick analysis - down;
- Trend analysis - up;
- Bollinger bands - up;
- Monthly chart - down.
All these points to a downward movement in GBP/USD.
Conclusion: The pair will have a bearish trend, with no first upper shadow on the weekly black candle (Monday - down) and a second lower shadow (Friday - up).
This week, the price may decline from 1.2328 (closing of the last weekly candle) to 1.2136, the 14.6% pullback level (yellow dotted line). When testing this level, an upward movement is possible with the target of 1.2499, the historical resistance level (blue dotted line).
Alternatively, the price may decline from the level of 1.2328 (closing of the last weekly candle) to the 1.2045 support level (thick white line). When testing this level, an upward movement is possible with the target of 1.2499, the historical resistance level (blue dotted line).