 English
  Русский
 Bahasa Indonesia
 Bahasa Malay
 ไทย
ไทย Español
 Deutsch
 Български
 Français
 Tiếng Việt
 中文
中文 বাংলা
বাংলা हिन्दी
 Čeština
 Українська
 Română

Trend analysis
GBP/USD may start moving down this week, starting from the level of 1.2414 (closing of the last weekly candle) to the 1.2351, which is the 23.6% retracement level (red dotted line). Upon reaching this price, the pair will resume an upward movement towards 1.2499, which is the historical resistance level (blue dotted line).
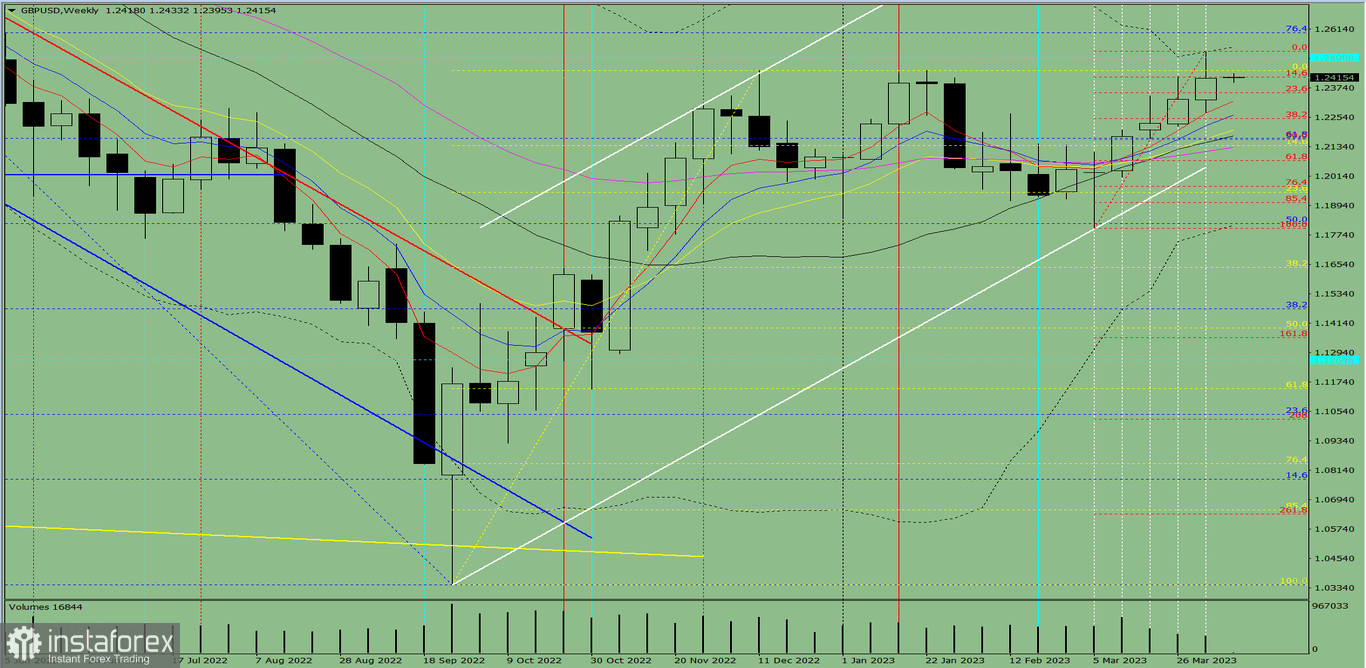
Fig. 1 (weekly chart)
Comprehensive analysis:
Indicator analysis - downward
Fibonacci levels - downward
Volumes - downward
Candlestick analysis - downward
Trend analysis - upward
Bollinger bands - upward
Monthly chart - downward
All these point to a downward movement in GBP/USD.
Conclusion: The pair is likely to have a bearish trend, with no first upper shadow on the weekly black candle (Monday - down) and a second lower shadow (Friday - up).
So during the week, pound may begin falling from the level of 1.2414 (closing of the last weekly candle) to the 23.6% retracement level at 1.2351 (red dotted line), and then rise to the historical resistance level at 1.2499 (blue dotted line).
Alternatively, the quote could move down from 1.2414 (closing of last week's candle) to the 38.2% retracement level at 1.2246 (red dotted line), and then rise to the historical resistance level at 1.2499 (blue dotted line).