 English
  Русский
 Bahasa Indonesia
 Bahasa Malay
 ไทย
ไทย Español
 Deutsch
 Български
 Français
 Tiếng Việt
 中文
中文 বাংলা
বাংলা हिन्दी
 Čeština
 Українська
 Română

Trend analysis (Fig. 1).
The market may move upward from the level of 1.0859 (closing of yesterday's daily candle) to the target of 1.0910, the 76.4% pullback level (red dotted line). Upon testing this level, a continued upward movement towards 1.0930, the historical resistance level (blue dotted line), is possible. After reaching this level, a downward correction is possible.
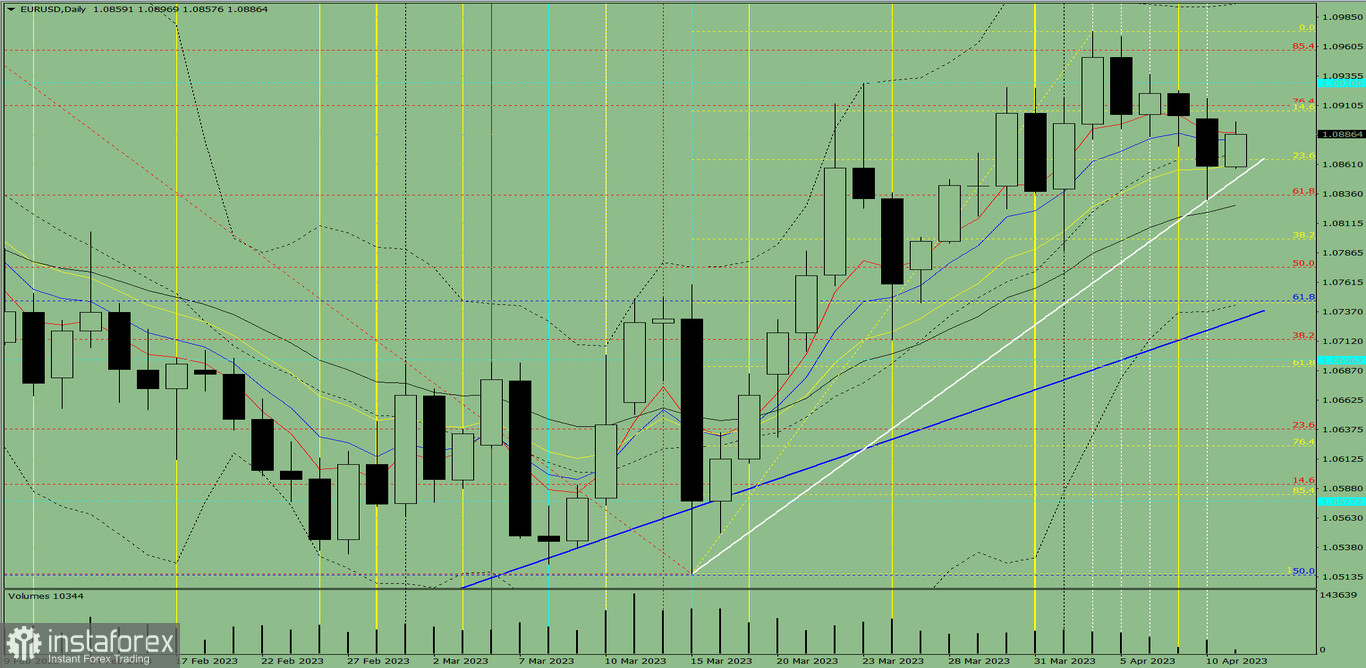
Fig. 1 (daily chart).
Comprehensive analysis:
- Indicator analysis - upward;
- Volumes - upward;
- Candle analysis - upward;
- Trend analysis - upward;
- Bollinger lines - upward;
- Weekly chart - upward.
Overall conclusion:
Today, the price may move upward from the level of 1.0859 (closing of yesterday's daily candle) to the target of 1.0910, the 76.4% pullback level (red dotted line). Upon testing this level, a continued upward movement towards 1.0930, the historical resistance level (blue dotted line), is possible. After reaching this level, a downward correction is possible.
Alternatively, the price may move upward from the level of 1.0859 (closing of yesterday's daily candle) to test 1.0910, the 76.4% pullback level (red dotted line). Upon testing this level, a downward movement towards 1.0865, the 23.6% pullback level (yellow dotted line), is possible.