 English
  Русский
 Bahasa Indonesia
 Bahasa Malay
 ไทย
ไทย Español
 Deutsch
 Български
 Français
 Tiếng Việt
 中文
中文 বাংলা
বাংলা हिन्दी
 Čeština
 Українська
 Română

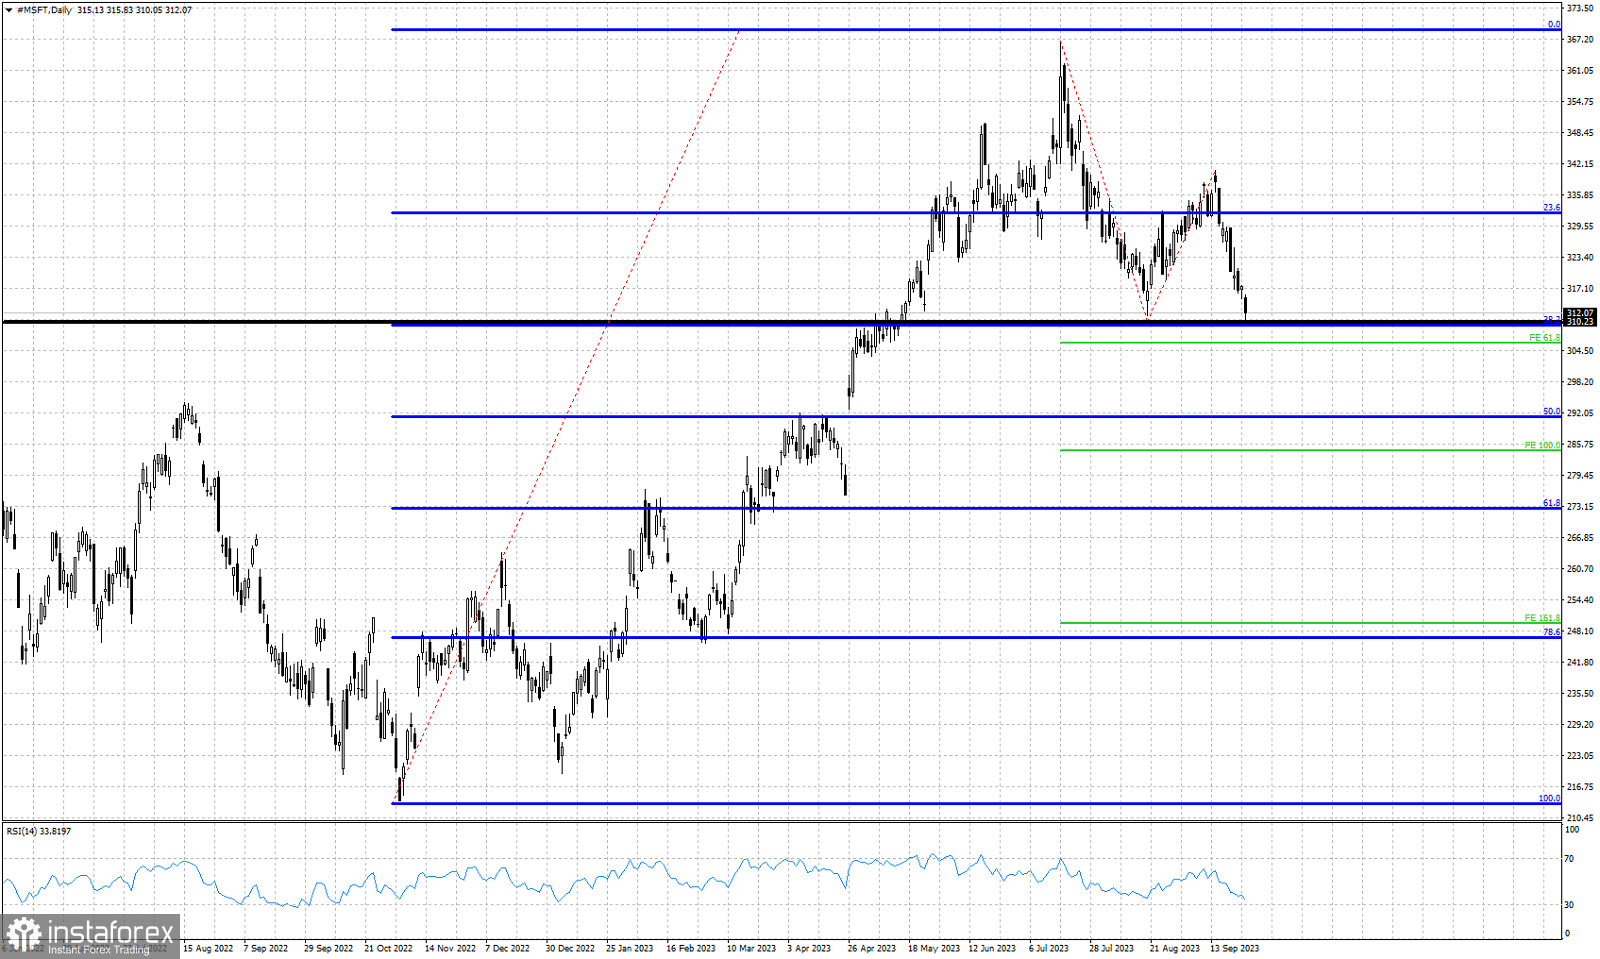
Black line- horizontal support
Blue lines- Fibonacci retracement levels
Green lines- Fibonacci extension targets
Following our past analysis on MSFT stock price we remain bearish seeing the vulnerability in price come to life as the stock price falls towards the August lows. Around the $310 price level we find the 38% Fibonacci retracement and the black horizontal trend line. Both provide key support for the stock price. A break below this support area is very possible. Such a break will open the way for a bigger decline towards $291, where we find the 50% Fibonacci retracement, and the $285 price level where we find the 100% Fibonacci extension target. If bulls manage to respect support at $310, then we could see price bounce towards the $329 resistance area.