 English
  Русский
 Bahasa Indonesia
 Bahasa Malay
 ไทย
ไทย Español
 Deutsch
 Български
 Français
 Tiếng Việt
 中文
中文 বাংলা
বাংলা हिन्दी
 Čeština
 Українська
 Română

Trend analysis (Fig. 1).
On Friday, the market will try to continue its upward movement from the 1.2518 level (closing of yesterday's daily candle) with the target of 1.2582, the historical resistance level (blue dotted line). Upon reaching this level, a downward pullback is possible.
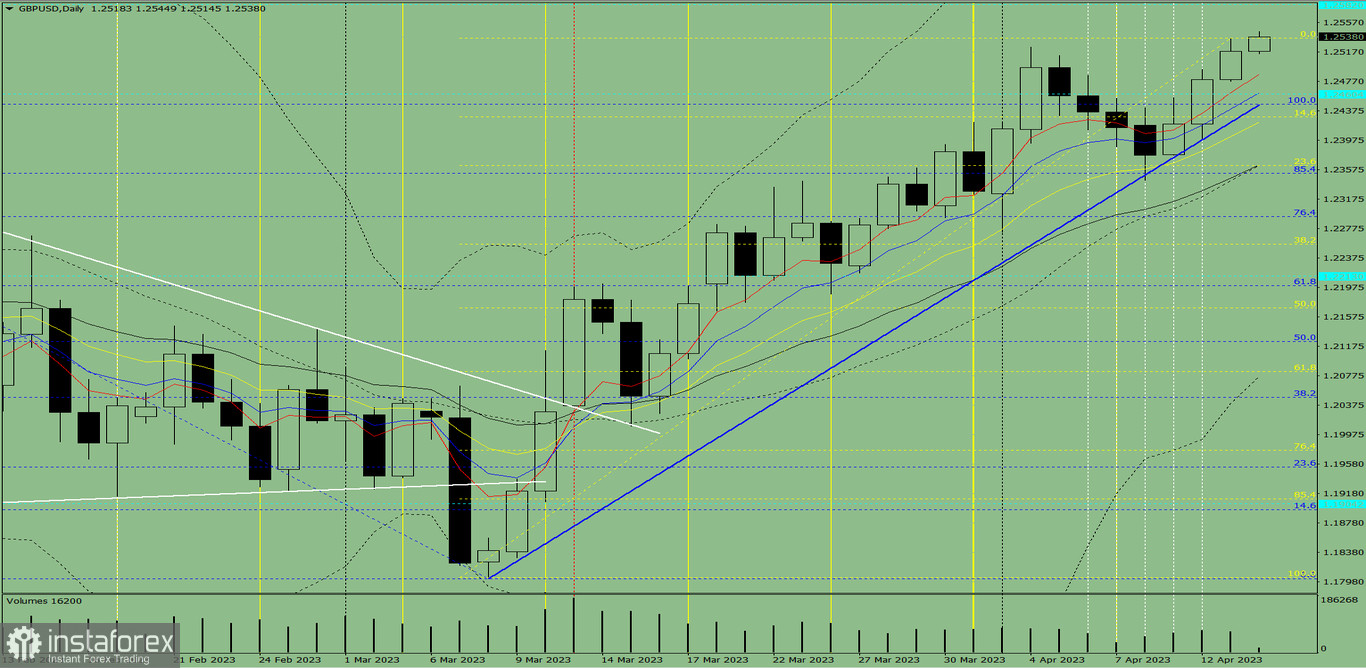
Fig. 1 (daily chart).
Comprehensive analysis:
- Indicator analysis - up;
- Fibonacci levels - up;
- Volumes - up;
- Candlestick analysis - up;
- Trend analysis - up;
- Bollinger bands - up;
- Weekly chart - up.
General conclusion:
Today, the price will try to continue its upward movement from the 1.2518 level (closing of yesterday's daily candle) with the target of 1.2582, the historical resistance level (blue dotted line). Upon reaching this level, a downward pullback is possible.
Alternatively, the price will try to continue its upward movement from the 1.2518 level (closing of yesterday's daily candle) with the target of 1.2536, the upper fractal (yellow dotted line). Upon reaching this level, a downward pullback is possible with the target of 1.2488, the 5-day EMA (thin red line).