 English
  Русский
 Bahasa Indonesia
 Bahasa Malay
 ไทย
ไทย Español
 Deutsch
 Български
 Français
 Tiếng Việt
 中文
中文 বাংলা
বাংলা हिन्दी
 Čeština
 Українська
 Română

Trend analysis (Fig. 1).
The market may move downward from the level of 1.2421 (closing of yesterday's daily candle) with the target at 1.2373, the 85.4% pullback level (blue dotted line). In the case of testing this level, the price may move upward with the target at 1.2449, the upper fractal (blue dotted line).
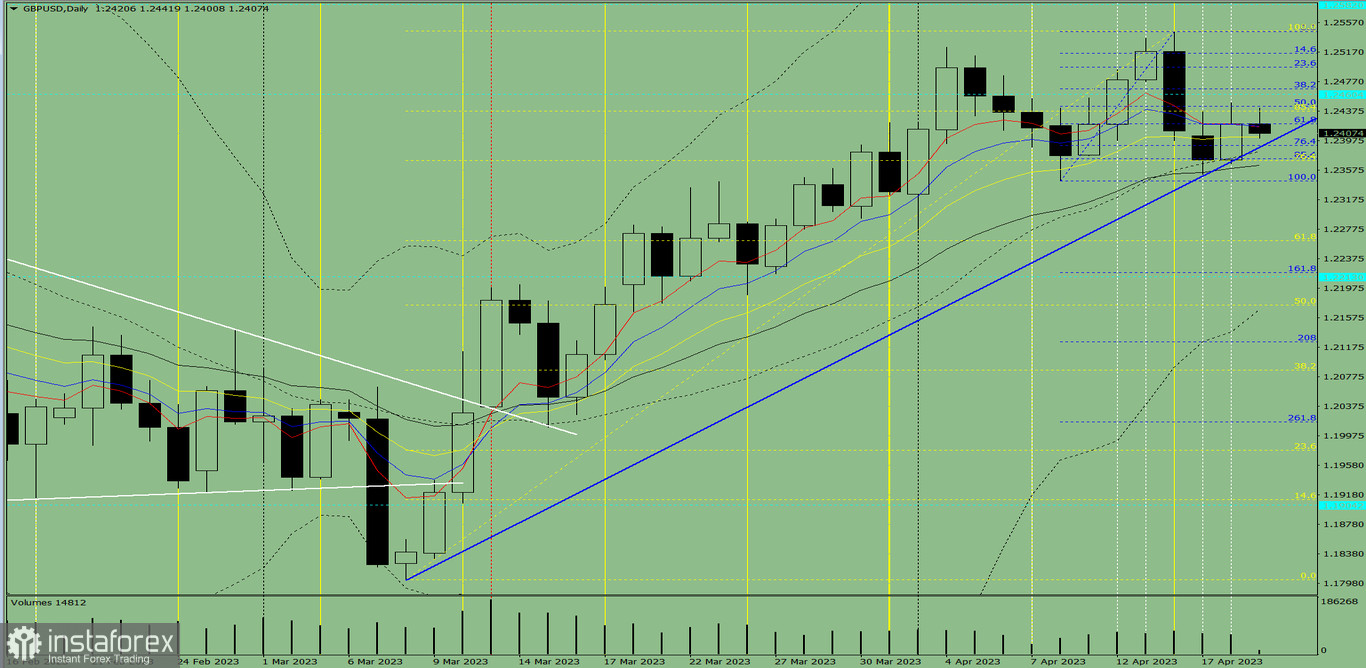
Fig. 1 (daily chart).
Comprehensive analysis:
- Indicator analysis - down;
- Fibonacci levels - down;
- Volumes - down;
- Candlestick analysis - down;
- Trend analysis - up;
- Weekly chart - down;
- Bollinger Bands - up.
General conclusion:
Today the price may move downward from the level of 1.2421 (closing of yesterday's daily candle) with the target at 1.2373, the 85.4% pullback level (blue dotted line). In the case of testing this level, the price may move upward with the target at 1.2449, the upper fractal (blue dotted line).
Alternatively, the price may move downward from the level of 1.2421 (closing of yesterday's daily candle) to 1.2343, the lower fractal (blue dotted line). In the case of testing this level, the price may move upward with the target at 1.2449, the upper fractal (blue dotted line).