 English
  Русский
 Bahasa Indonesia
 Bahasa Malay
 ไทย
ไทย Español
 Deutsch
 Български
 Français
 Tiếng Việt
 中文
中文 বাংলা
বাংলা हिन्दी
 Čeština
 Українська
 Română

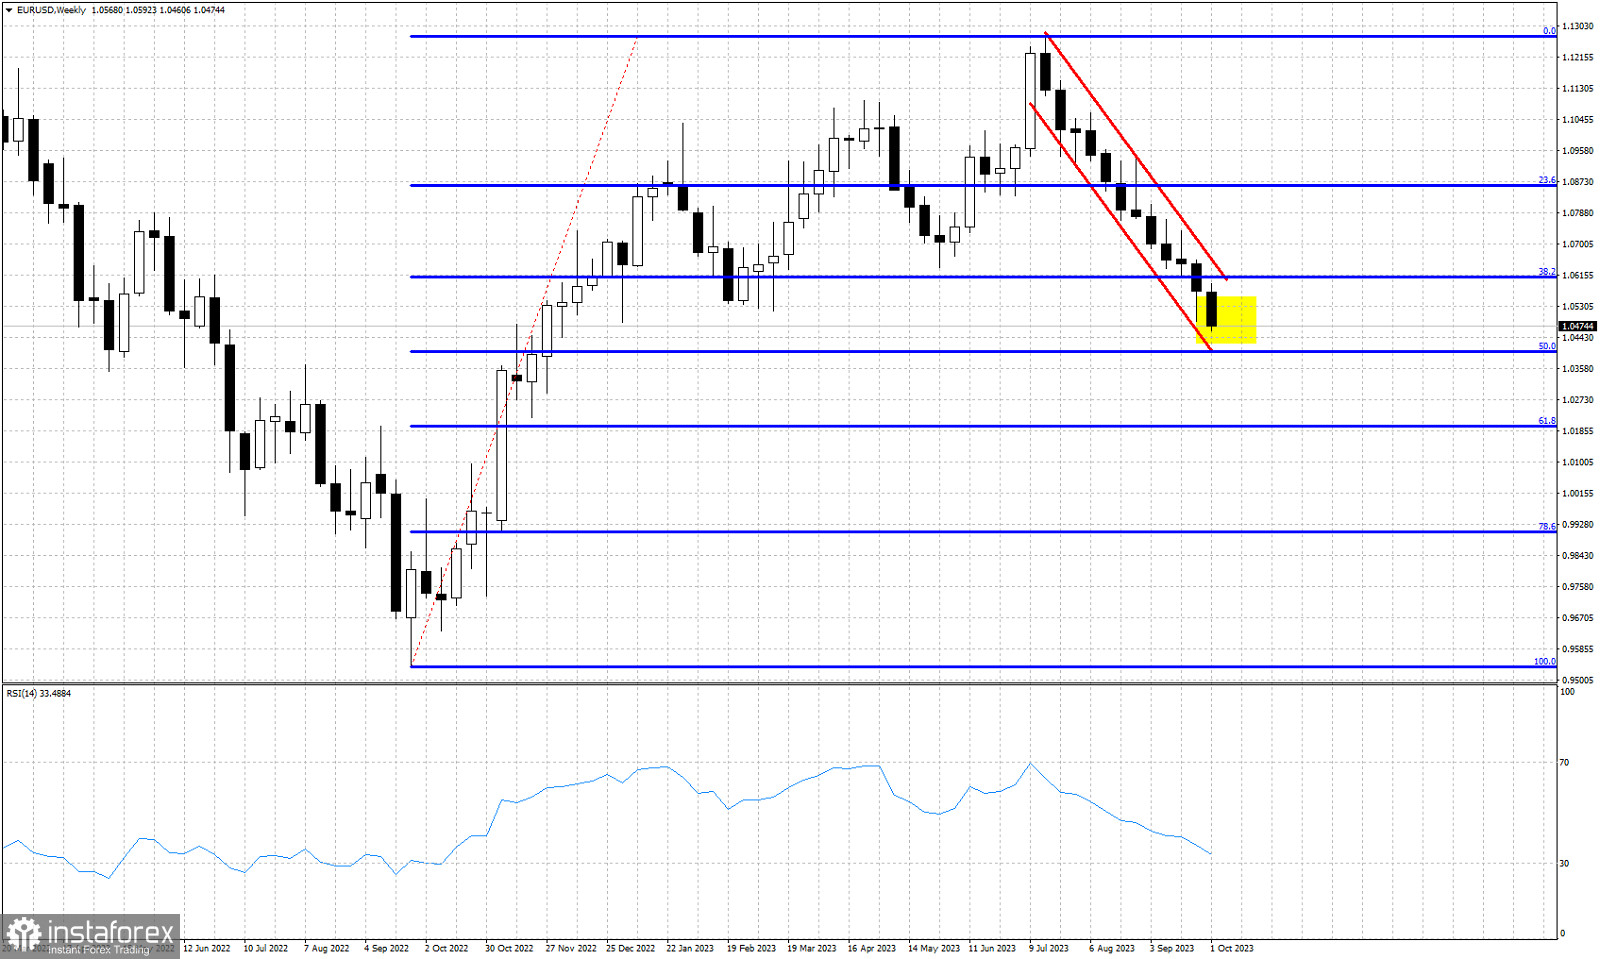
Blue lines- Fibonacci retracement levels
Red lines- bearish channel
Yellow rectangle- expected bottom area
EURUSD is trading around 1.0473. Price is making new lower lows . Despite the short-term bounce towards 1.0617, bulls remain weak as price falls to new lows. Trend remains clearly bearish in all time frames as this is the 12th week in a row with EUR under pressure. In the Daily chart the RSI is not making new lows. The RSI provides a bullish divergence. However this is not a reversal signal. Only a warning to bears. As we mentioned in our previous posts, we expect a strong bounce from the yellow rectangle area. Price is very close to the 50% Fibonacci retracement level (1.0405). The combination of the Fibonacci support and the bullish divergence, suggests that downside is limited in the near term.