 English
  Русский
 Bahasa Indonesia
 Bahasa Malay
 ไทย
ไทย Español
 Deutsch
 Български
 Français
 Tiếng Việt
 中文
中文 বাংলা
বাংলা हिन्दी
 Čeština
 Українська
 Română

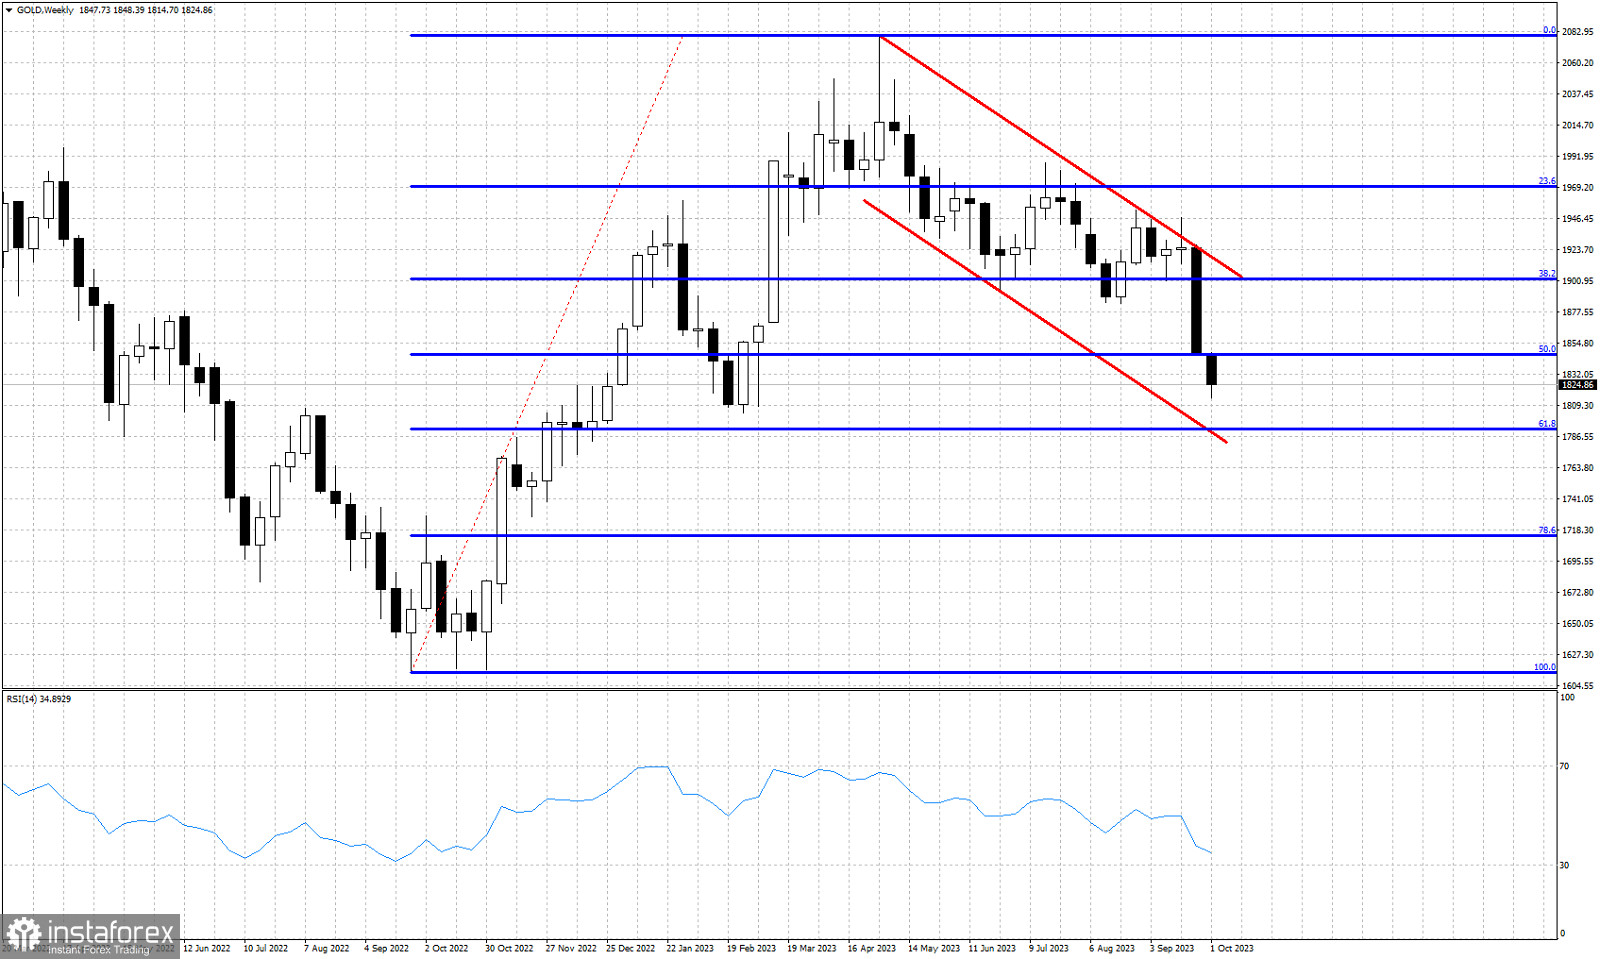
Blue lines- Fibonacci retracement levels
Red lines- bearish channel
Gold price is trading around $1,827. under pressure for a second day. Price has broken below the 50% Fibonacci retracement level. Next key support is at $1,792 where we find the 61.8% Fibonacci retracement level. Gold remains inside the weekly bearish channel. Gold price could continue lower towards $1,792, but in the near term the RSI is at oversold levels and a bounce towards $1,850-60 is justified and expected. I expect to see such a bounce this week. Gold remains vulnerable to more downside and I do not see any sign of a major bottom near by.