 English
  Русский
 Bahasa Indonesia
 Bahasa Malay
 ไทย
ไทย Español
 Deutsch
 Български
 Français
 Tiếng Việt
 中文
中文 বাংলা
বাংলা हिन्दी
 Čeština
 Українська
 Română

Trend analysis (fig. 1).
Today, the pair could drop to the support level of 1.0930 (blue dotted line) from 1.0968 (the closing of yesterday's daily candlestick. When testing this level, it may rebound.
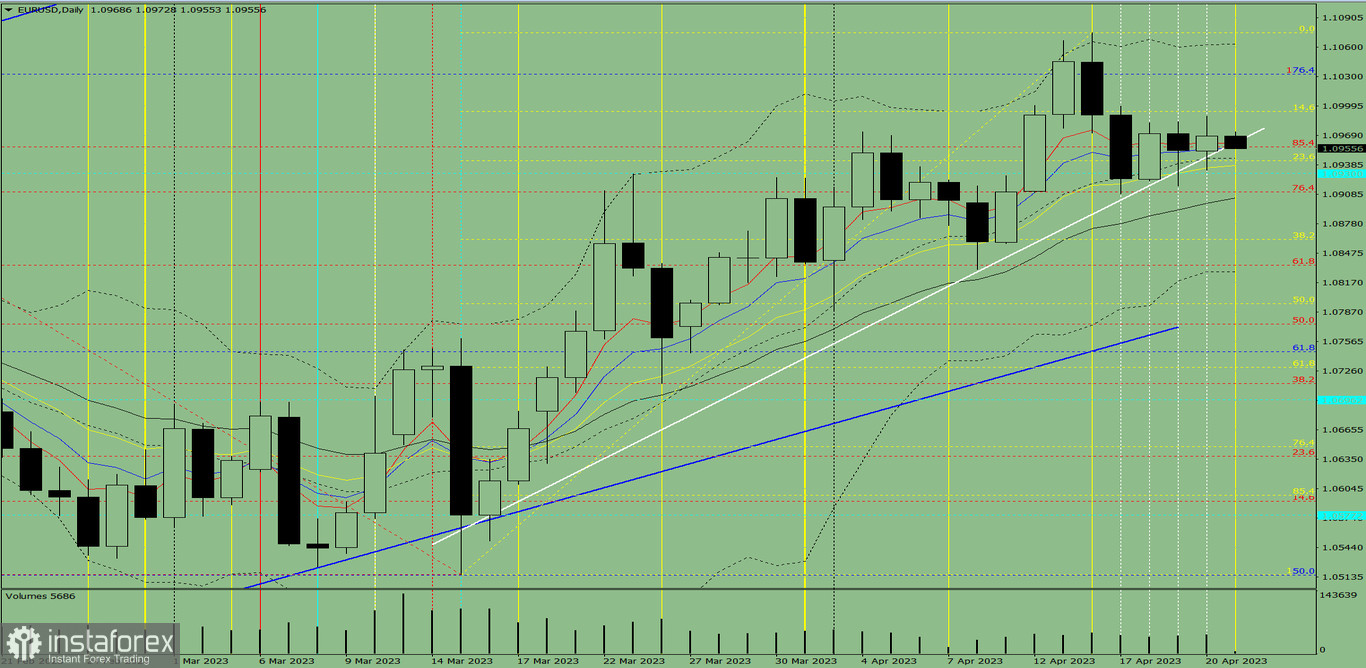
Fig. 1 (daily chart).
Complex analysis:
- indicator analysis– down;
- Fibonacci correction levels – down;
- trading volumes – down;
- candlestick analysis – down;
- trend analysis – up;
- Bollinger lines – up;
- weekly chart - down.
Conclusion:
Today, the pair could fall to the support level of 1.0930 (blue dotted line) from 1.0968 (the closing of yesterday's daily candlestick. When testing this level, it may rebound.
Alternatively, the price might decrease to 1.0911, the Fibonacci correction level of 76.4% (red dotted line) from 1.0968 (closing of yesterday's daily candlestick). When testing this level, it is likely to grow to 1.0994, the Fibonacci correction level of 14.6% (yellow dotted line).