 English
  Русский
 Bahasa Indonesia
 Bahasa Malay
 ไทย
ไทย Español
 Deutsch
 Български
 Français
 Tiếng Việt
 中文
中文 বাংলা
বাংলা हिन्दी
 Čeština
 Українська
 Română

Trend analysis (Fig. 1).
On Friday, the pair will attempt to go down from 1.2438 (the close of yesterday's candlestick) to the 76.4% retracement level of 1.2391 (the blue dotted line). A bullish correction will occur if the pair reaches the target.
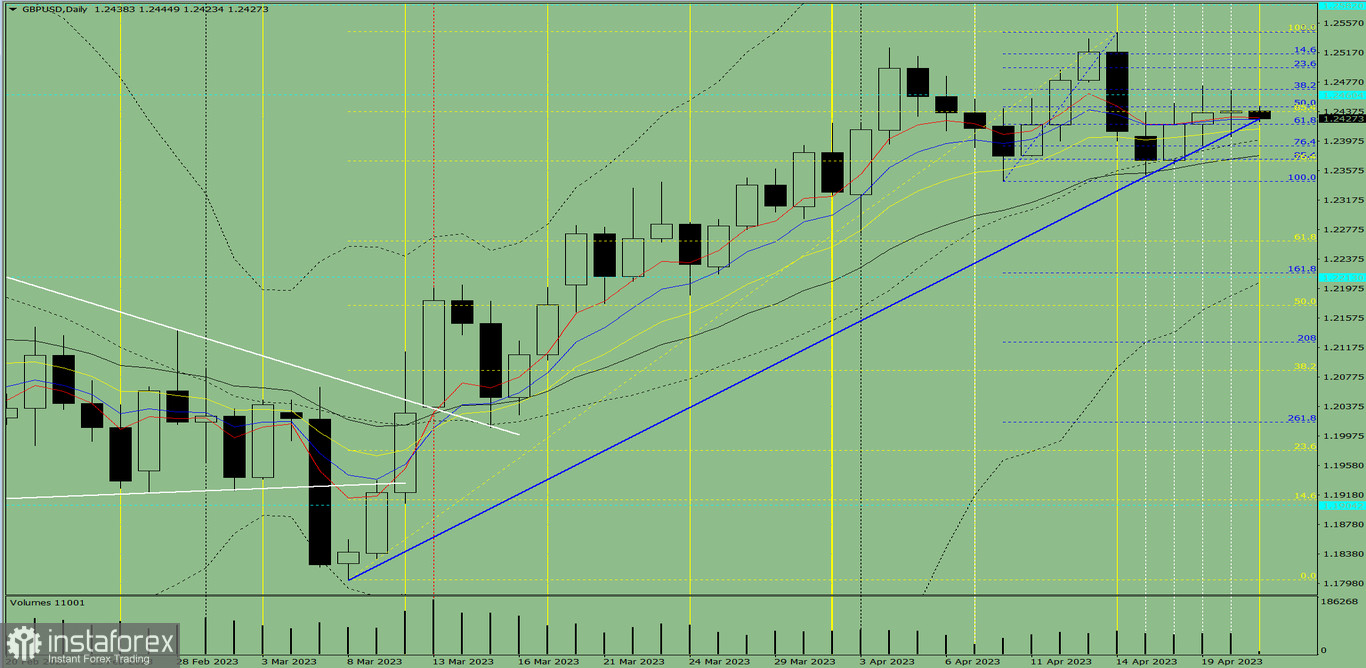
Fig. 1 (daily chart).
Complex analysis:
- indicator analysis - down;
- Fibonacci levels - down;
- volumes - down;
- candlestick analysis - down;
- trend analysis - up;
- Bollinger bands - up;
- weekly chart - down.
Final thoughts:
Today, the pair will attempt to go down from 1.2438 (the close of yesterday's candlestick) to the 76.4% retracement level of 1.2391 (the blue dotted line). A bullish correction will occur if the pair reaches the target. In such a case, the mark of 1.2467 will stand as the next target.
Alternatively, from the level of 1.2438 (the close of yesterday's candlestick), the price may fall to the 85.4% retracement level of 1.2373 (the blue dotted line). A bullish correction may occur if the pair reaches the target. In such a case, the mark of 1.2473 will stand as the next target (the daily candlestick formed on April 19, 2023).