 English
  Русский
 Bahasa Indonesia
 Bahasa Malay
 ไทย
ไทย Español
 Deutsch
 Български
 Français
 Tiếng Việt
 中文
中文 বাংলা
বাংলা हिन्दी
 Čeština
 Українська
 Română

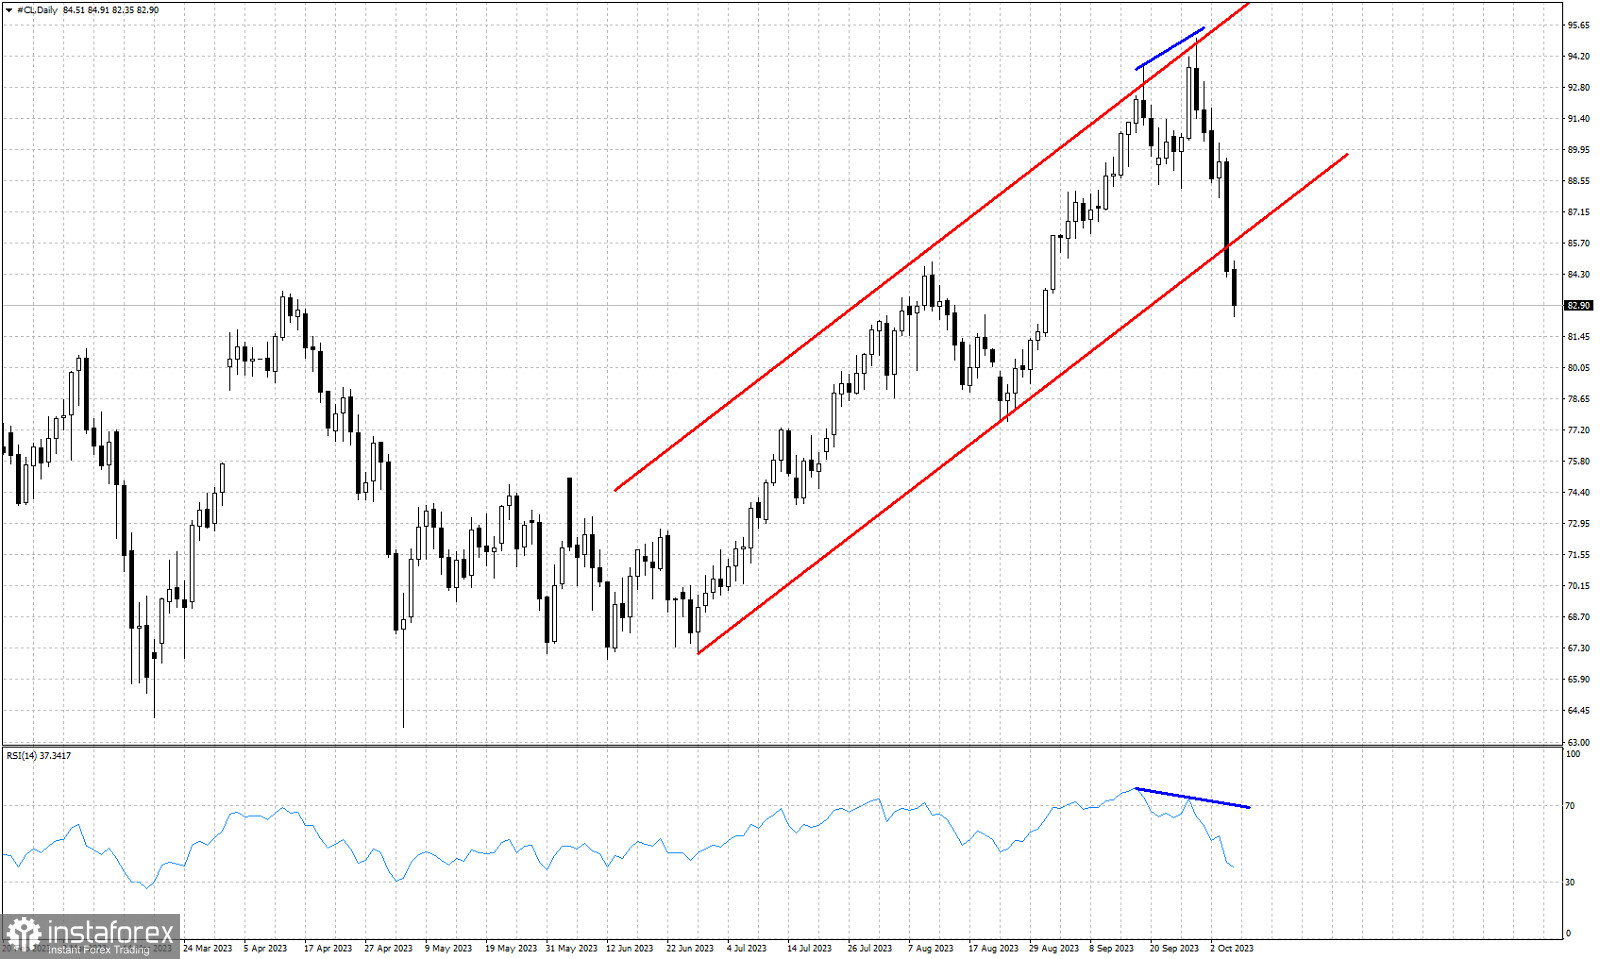
Red lines- bullish channel
Blue line- bearish RSI divergence
Oil price is under pressure again. Price has broken out and below the bullish channel it was and is now trading around $84-$83. Short-term trend is clearly bearish and the entire upward move from $67 is complete. We are now correcting this upward wave. We warned traders on time for this coming pull back and we now look to find price levels of support. At $81-$80.80 we find the 50% Fibonacci retracement of the upward wave. Price has so far broken below the 38% Fibonacci level confirming that bears are in control of the near term trend. The RSI is far from oversold levels in the Daily chart. Our view remains bearish in Oil.