 English
  Русский
 Bahasa Indonesia
 Bahasa Malay
 ไทย
ไทย Español
 Deutsch
 Български
 Français
 Tiếng Việt
 中文
中文 বাংলা
বাংলা हिन्दी
 Čeština
 Українська
 Română

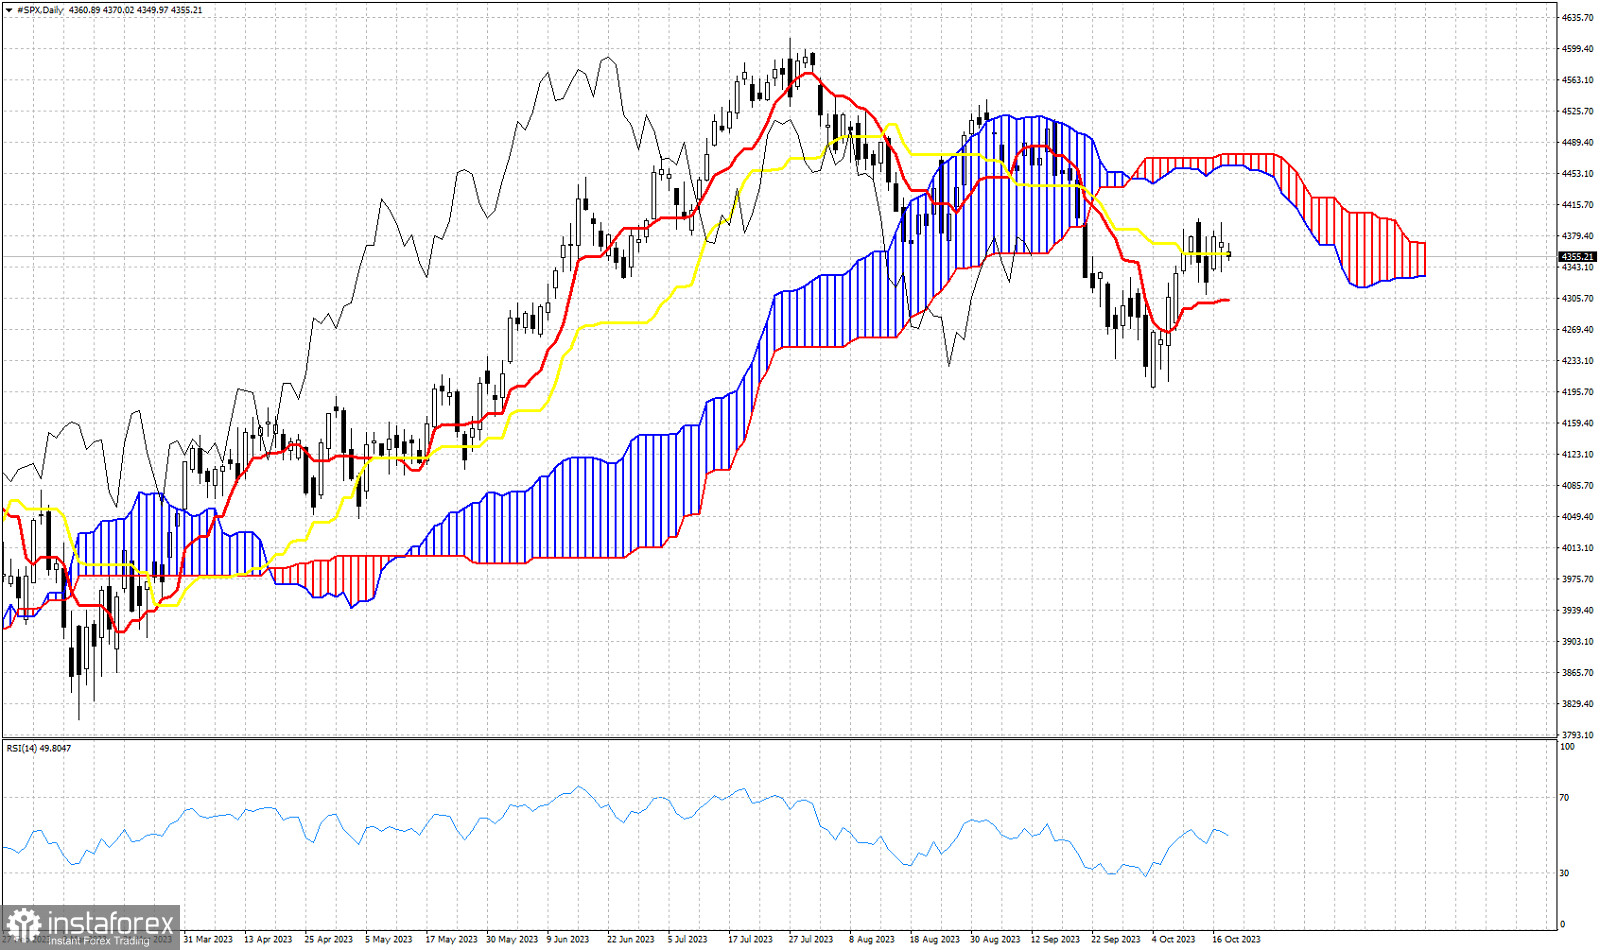
SPX is trading around 4.355. Today we use the Ichimoku cloud indicator to identify key support and resistance levels. In Ichimoku cloud terms trend in the Daily chart remains bearish as price is still below the Daily KUMO (cloud). SPX is trading around the kijun-sen (yellow line indicator). This is a very important pivot point for the near term. A daily close below the kijun-sen at 4,358 will be a sign of weakness and will open the way for a decline towards the tenkan-sen (red line indicator) at 4,303. A break below the tenkan-sen will open the way for new lower lows. The Chikou span (black line indicator) is below the candlestick pattern (bearish). Concluding according to the Ichimoku cloud indicator SPX remains vulnerable to the downside. In order for a trend change, we will need to see the index break above the Kumo resistance at 4,475.