 English
  Русский
 Bahasa Indonesia
 Bahasa Malay
 ไทย
ไทย Español
 Deutsch
 Български
 Français
 Tiếng Việt
 中文
中文 বাংলা
বাংলা हिन्दी
 Čeština
 Українська
 Română

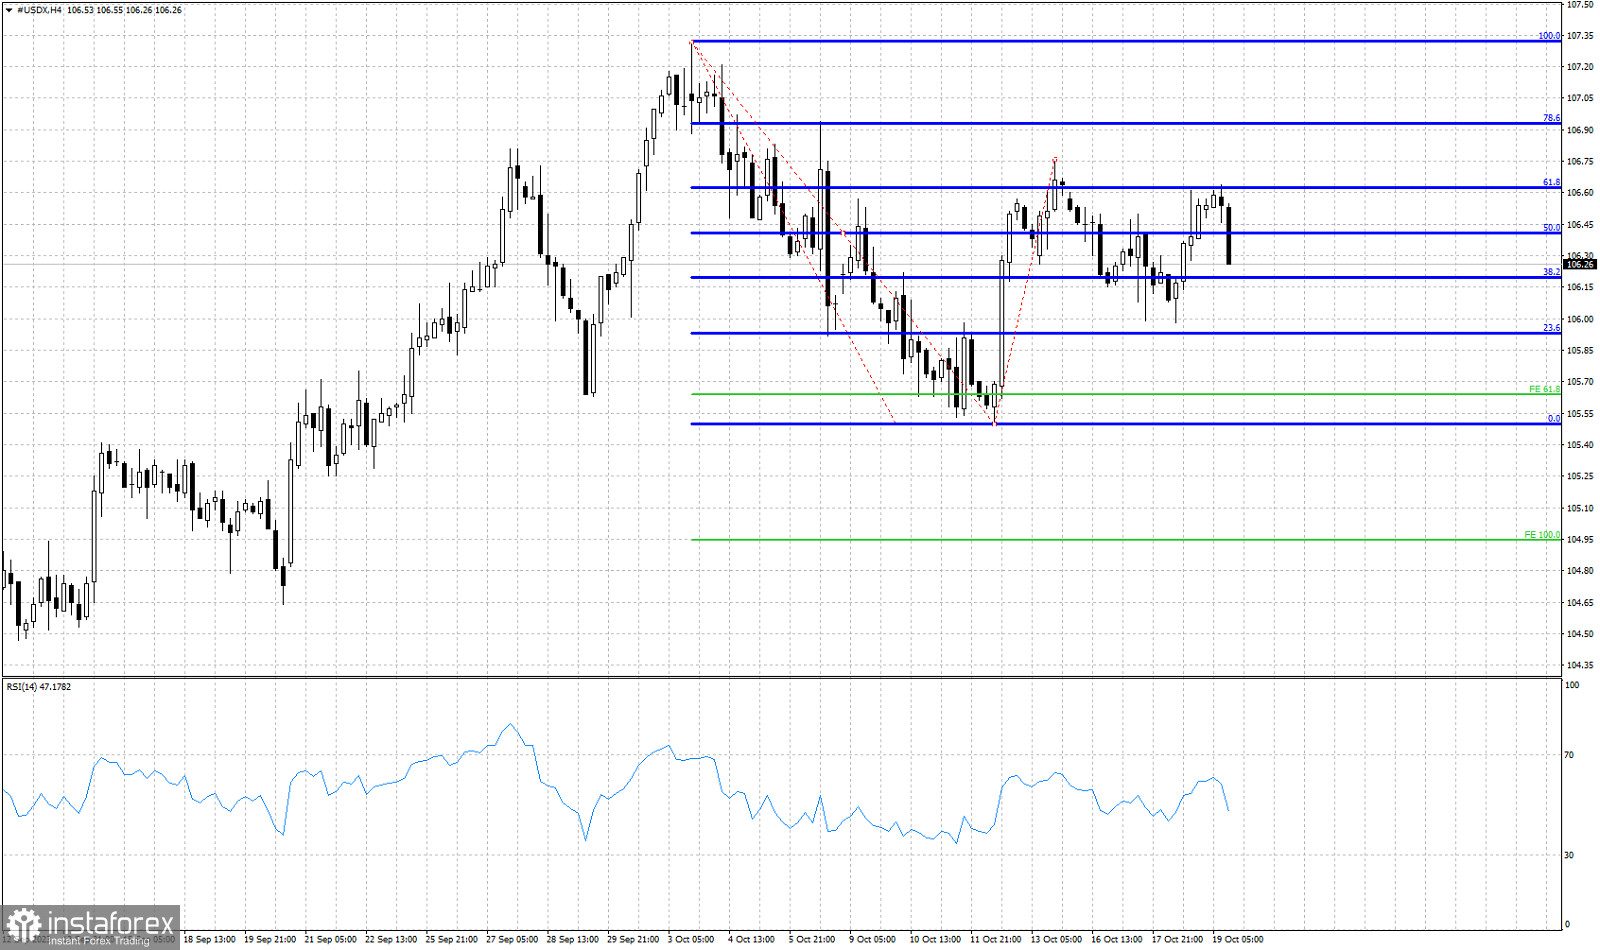
Blue lines- Fibonacci retracement levels
green lines- Fibonacci extension targets
The Dollar index is trading around 106.30. Price has so far retraced 61.8% of the decline from 107.32 to the 105.51 lows. Price has already got rejected once at this important Fibonacci resistance. A second rejection combined with a lower high would be a new sign of weakness. Short-term support is found at recent low of 105.98 and next at 105.51. Failure to defend 105.98 will open the way for the start of a new downward wave that could push the index towards the 100% Fibonacci extension target at 104.94. On the other hand if bulls manage to recapture 106.40 and stay above it, we could see a new upward wave towards 107-108. The RSI does not have a clear picture of who is currently in control. Trend remains unclear.