 English
  Русский
 Bahasa Indonesia
 Bahasa Malay
 ไทย
ไทย Español
 Deutsch
 Български
 Français
 Tiếng Việt
 中文
中文 বাংলা
বাংলা हिन्दी
 Čeština
 Українська
 Română

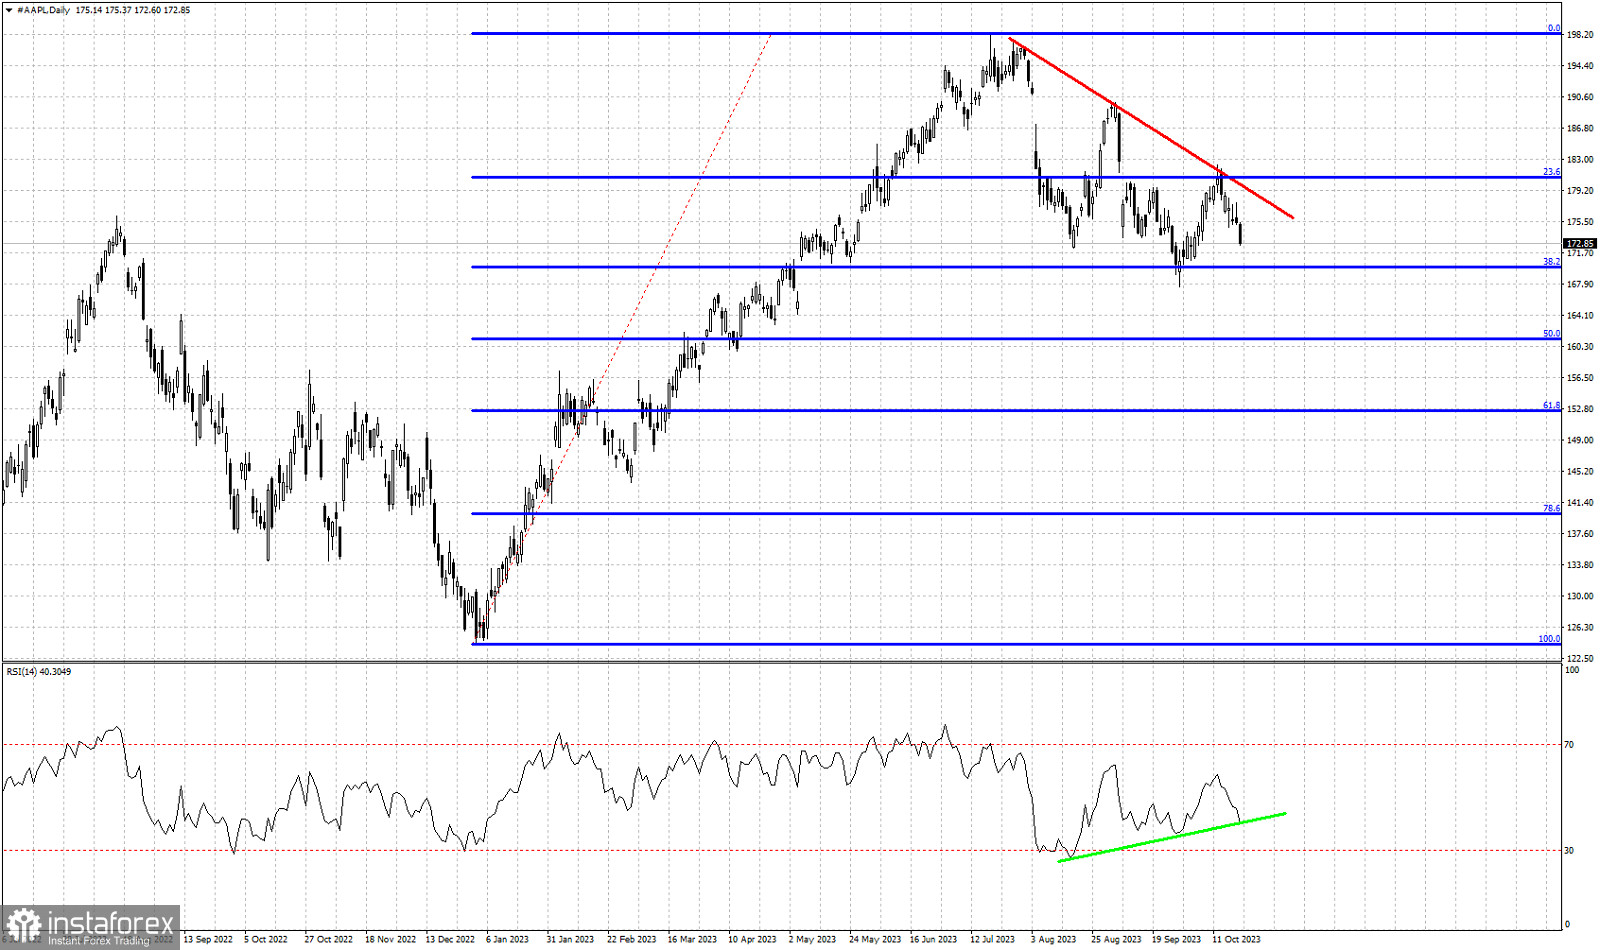
Red lines- bearish trend line
Blue lines- Fibonacci retracement levels
green line- RSI support trend line
AAPL stock price closed at its weekly low this past week. Price got rejected at the red resistance trend line at $182 resistance area and is now moving lower as expected by our previous analysis. Thus far price has formed two lower highs and two lower lows. Will we see a third lower low? Support is found at $170 where we see the 38% Fibonacci retracement where price bounced off last time. The RSI is challenging its own support trend line at recent close of $172.85. If selling pressures continue next week, we should expect $170 to be tested and maybe see new lower lows towards the 50% Fibonacci retracement at $161.30. Bears remain in control of the trend. So far we have no indication of a major low or trend reversal.