 English
  Русский
 Bahasa Indonesia
 Bahasa Malay
 ไทย
ไทย Español
 Deutsch
 Български
 Français
 Tiếng Việt
 中文
中文 বাংলা
বাংলা हिन्दी
 Čeština
 Українська
 Română

Trend analysis (Fig. 1).
The market may move downward from the level of 1.2525 (closing of yesterday's daily candle) to test the 1.2446 support level (thick white line). Upon testing this level, an upward movement is possible to 1.2460, the historical resistance level (blue dotted line).
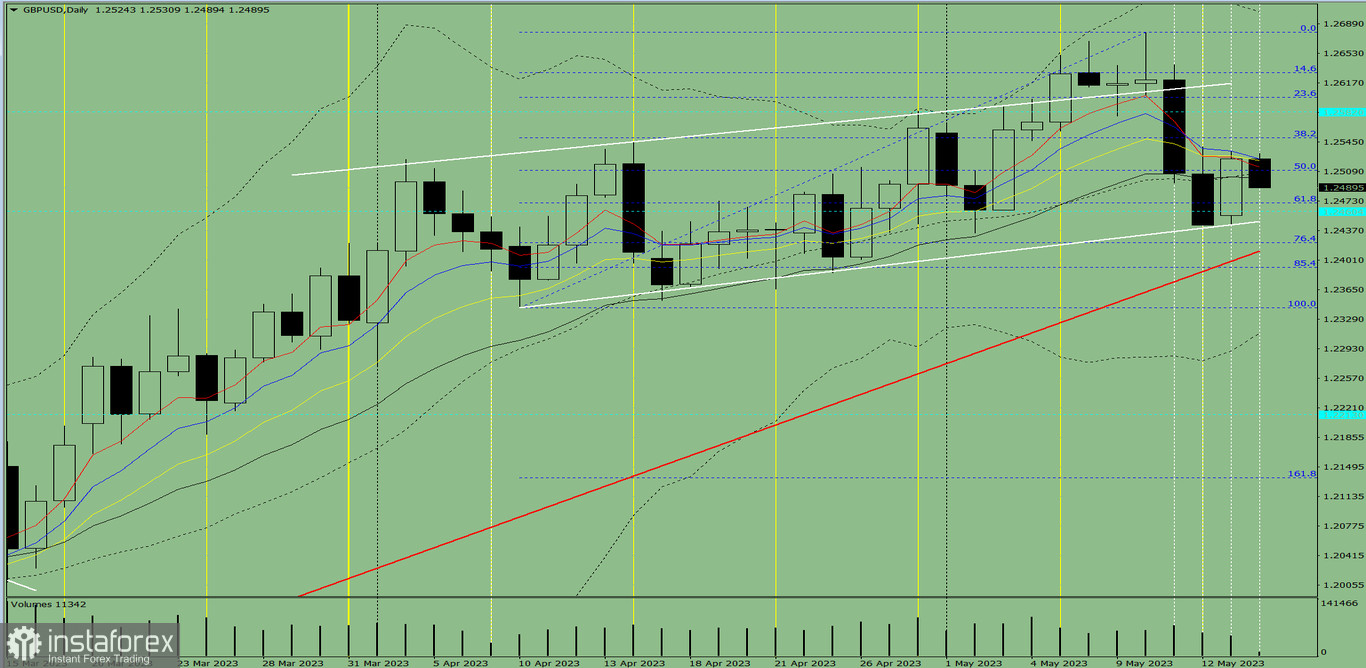
Fig. 1 (daily chart).
Comprehensive analysis:
- Indicator analysis - down;
- Volumes - down;
- Candlestick analysis - down;
- Trend analysis - up;
- Bollinger bands - up;
- Weekly chart - down.
General conclusion:
Today, the price may move downward from the level of 1.2525 (closing of yesterday's daily candle) to test the 1.2446 support level (thick white line). Upon testing this level, an upward movement is possible to 1.2460, the historical resistance level (blue dotted line).
Alternatively, the price may move downward from the level of 1.2525 (closing of yesterday's daily candle) to test 1.2422, the 76.4% pullback level (blue dotted line). Upon testing this level, an upward movement is possible to the 1.2446 resistance level (thick white line).