 English
  Русский
 Bahasa Indonesia
 Bahasa Malay
 ไทย
ไทย Español
 Deutsch
 Български
 Français
 Tiếng Việt
 中文
中文 বাংলা
বাংলা हिन्दी
 Čeština
 Українська
 Română

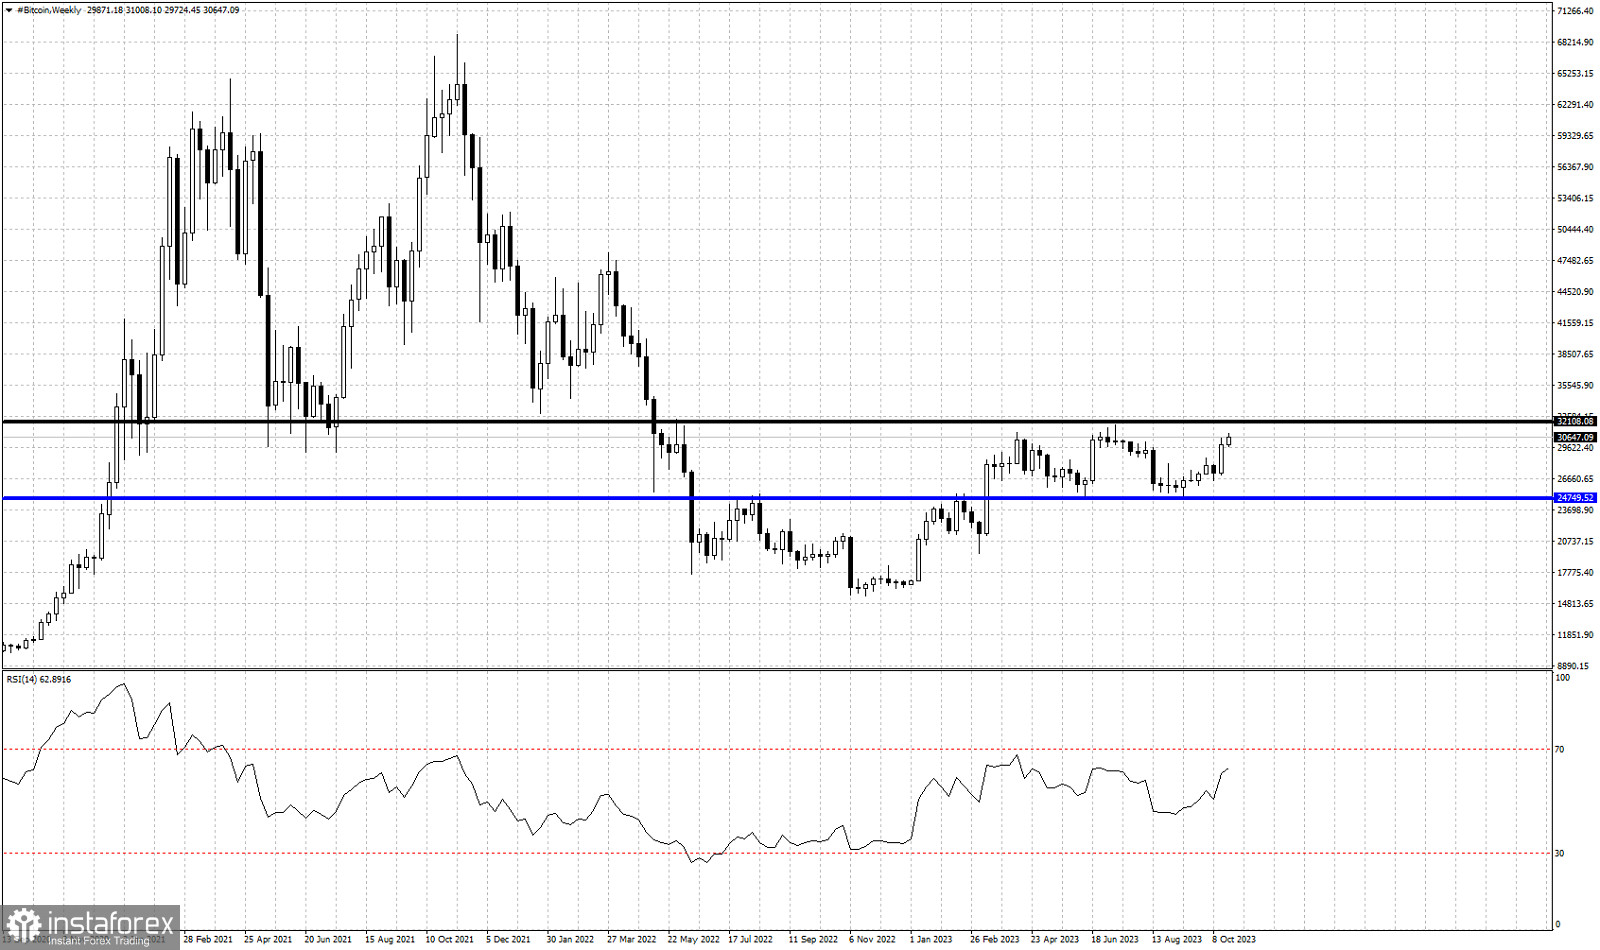
Black line- horizontal resistance
Blue line- horizontal support
Bitcoin is trading once again above $30,000 price level. Short-term trend is bullish after the bounce off the blue horizontal support line at $24,750. Bitcoin bulls are now challenging the black horizontal resistance line around $32,100. Bitcoin price has made no real progress over the last 7 moths. Price has been trading inside this trading range of $32,000-$24,700. The support has been tested two times and both times bulls managed to defend it. The resistance around $32,000 was also tested two times and bulls failed both times to break above it. This is the 3rd time to test this resistance. It will be an important bullish sign if there is a break out.