 English
  Русский
 Bahasa Indonesia
 Bahasa Malay
 ไทย
ไทย Español
 Deutsch
 Български
 Français
 Tiếng Việt
 中文
中文 বাংলা
বাংলা हिन्दी
 Čeština
 Українська
 Română

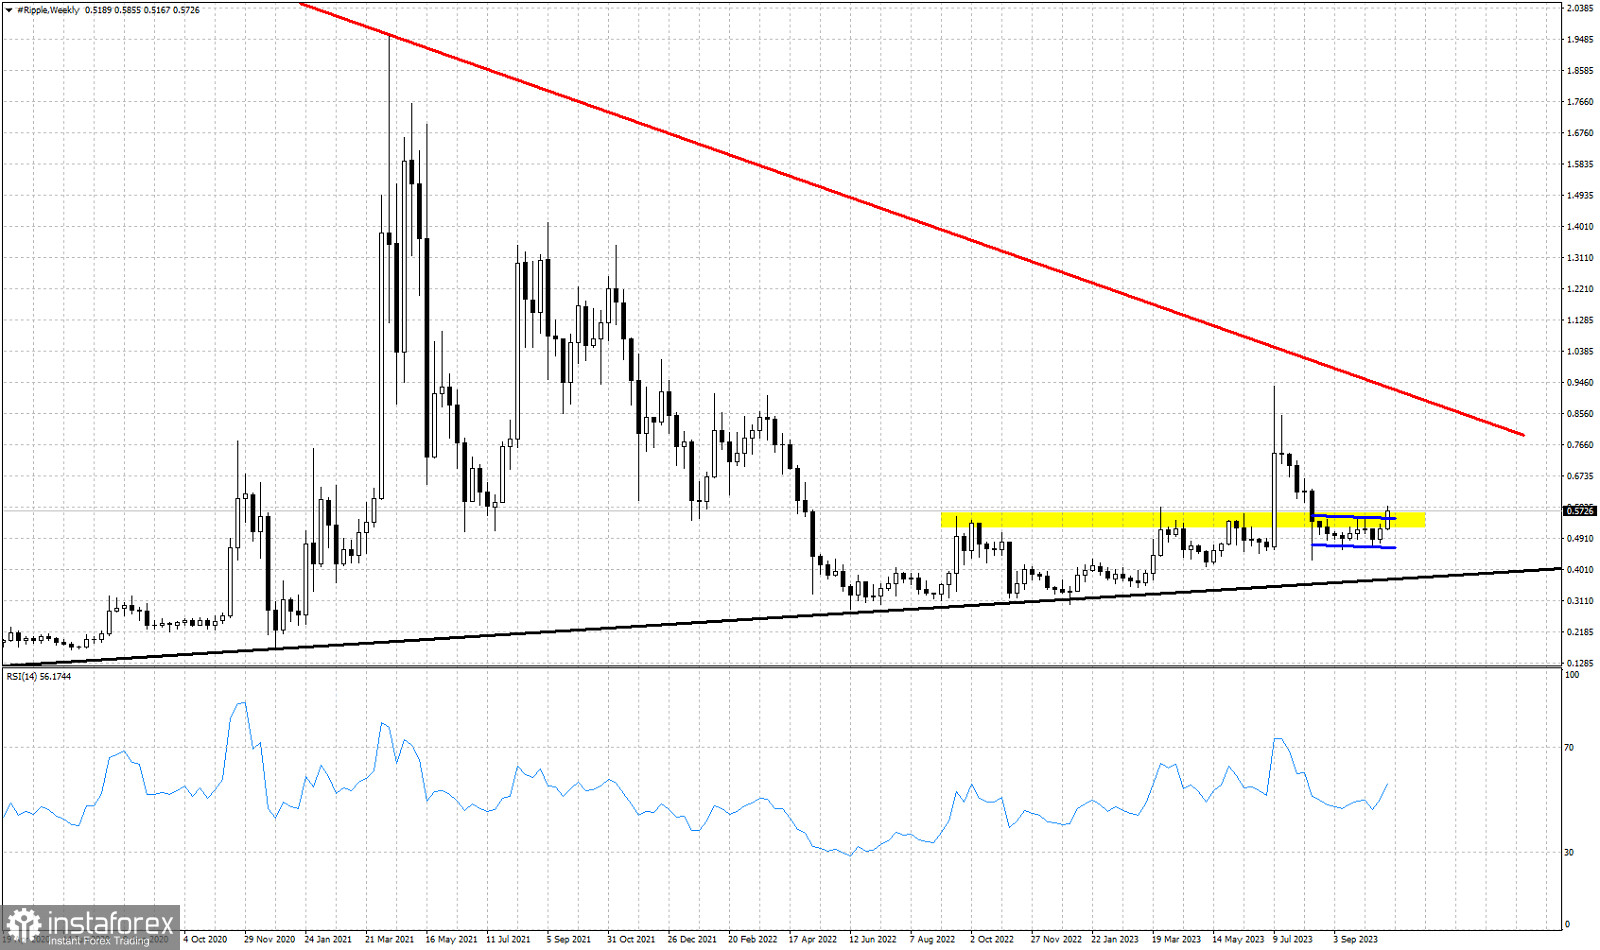
Red line- major resistance trend line
Black line- support trend line
Yellow rectangle- horizontal resistance area
Blue lines- trading range
XRPUSD is trading around $0.57 today. Today's price action is promising as price is breaking above the yellow rectangle resistance area and XRPUSD is also breaking above and out of the trading range it was over the last 2 months. If bulls manage to maintain price above $0.55, then there is potential for XRPUSD to continue even higher towards the next major resistance at $0.75. Bulls need to break above $0.75 in order to hope for a bigger bounce towards the major red resistance trend line. Inability to break above $0.75 will result in the formation of a new lower high and the reversal back towards the black long-term support trend line. Short-term momentum is bullish. Bulls want to close the week above $0.55.